The 2020 edition of the Milliman Corporate Pension Funding Study (PFS) is our 20th annual analysis of the financial disclosures of the 100 U.S. public companies sponsoring the largest defined benefit (DB) pension plans. These 100 companies are ranked highest to lowest by the value of their pension assets reported to the public as of the end of fiscal year 2019, to shareholders, and to the U.S. federal agencies that have an interest in such disclosures.
Looking back to 2019 in April 2020 may seem irrelevant as we are dealing with the global pandemic’s horror and destruction to the health, jobs, businesses, and financial assets of everyone. Congress has enacted the CARES Act that has implications for decisions employers can or will make on managing these pension plans. CARES also enacts many changes to defined contribution plans which could result in declining account balances for hardship distributions, loans, and investment losses. We respectfully keep this in mind as we recap pension funding in 2019.
FIGURE 1: DISTRIBUTION BY FUNDED RATIO
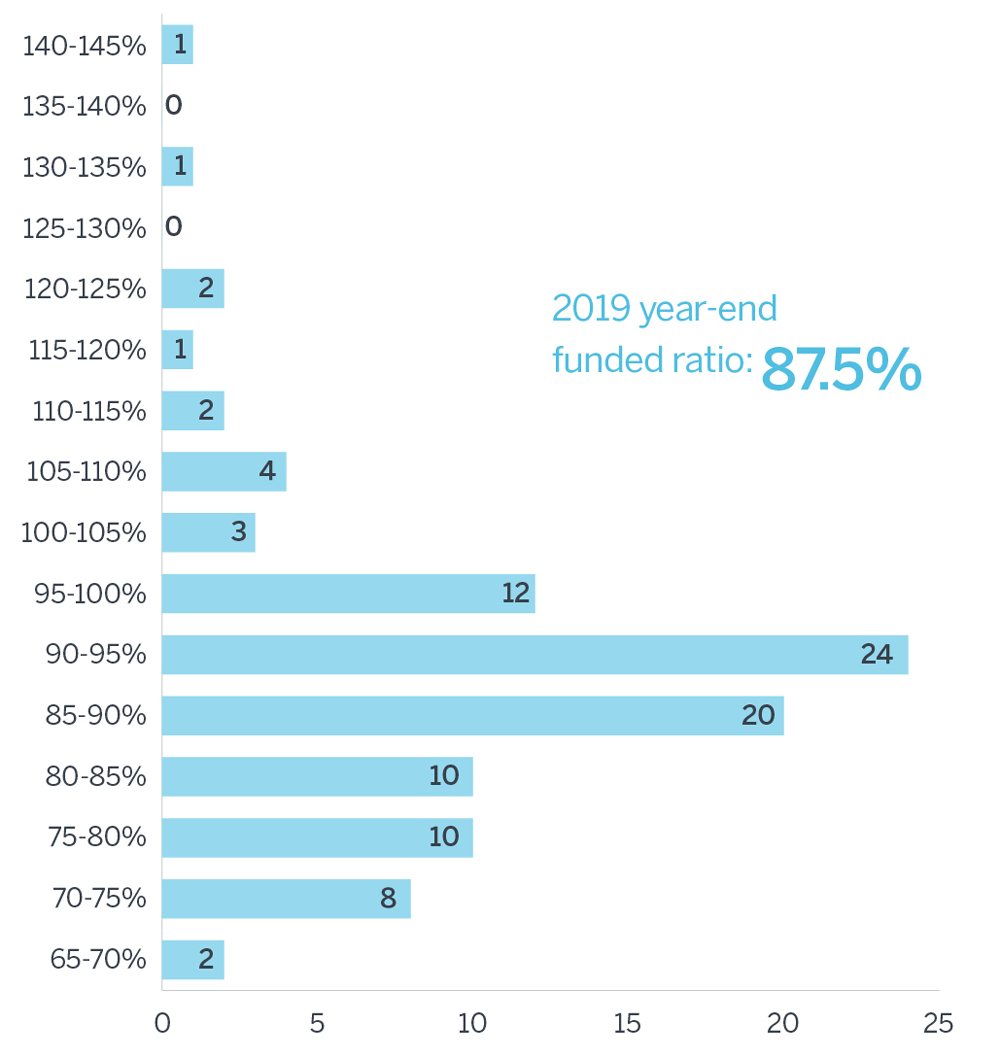
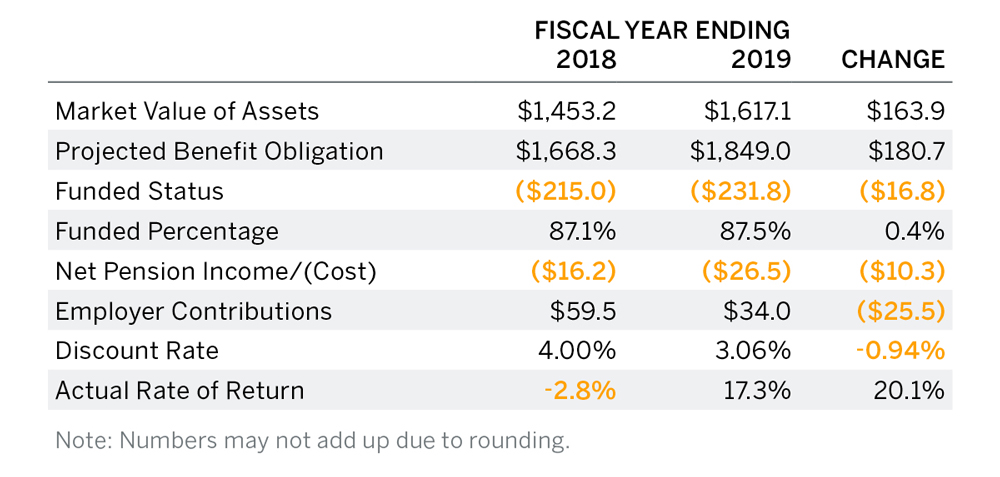
Despite a drop of 94 basis points in discount rates, the private single-employer defined benefit plans of the Milliman 100 companies continued to make funding progress in 2019 due to their stellar investment returns of 17.3%. The year-end 2019 funded ratio for the Milliman 100 companies settled at 87.5%, a slight improvement from the year-end 2018 funded ratio of 87.1%. Fourteen plans had a funded ratio of at least 100% compared to 16 plans from the 2019 Milliman PFS. However, due to a matching 11% growth in both assets and liabilities, the funding deficit grew by $17 billion, ending the year at $232 billion.
Contributions of $34.0 billion in 2019 were lower than expected, after two years of record high contributions ($59.5 billion in 2018 and $61.8 billion in 2017). Thirteen employers contributed at least $1 billion in 2019, similar to 2018. 2019’s largest contribution was by United Parcel Service, Inc. ($2.1 billion); compared to 2018 when six employers made larger contributions, the highest being AT&T’s $9.3 billion.
After a disappointing 2018 investment loss of 2.8%, the financial markets rebounded in 2019 permitting these pensions to post a 17.3% investment return. It was the second best year in the history of the study (exceeded only by the 19.5% return earned in 2003). The strong investment return in 2019 increased plan assets by $243 billion compared to the expectation that investments would only add $94 billion, based on the companies’ long-term investment return assumptions. The Milliman 100 plans’ assets increased to an all-time high of $1.62 trillion from $1.45 trillion.
However, this record asset level was offset by soaring liability values as the average discount rate dropped by 94 basis points to 3.06% from 4.00%. This is the largest one-year discount rate decrease in the history of our study; the previous largest decrease was 79 basis points in 2014. The pension benefit obligation (PBO) of the Milliman 100 plans increased to a new all-time high of $1.85 trillion from $1.67 trillion.
Pension expense (the charge to the income statement under Accounting Standards Codification Subtopic 715) increased to $26.5 billion in fiscal year (FY) 2019 from $16.2 billion in FY2018. This reversed the trend in recent years of decreasing expense charges since the all-time high of $56.2 billion in FY2012.
We noted a modest decline in life expectancy assumptions; participants and pensioners will not live as long as previously assumed based on use of the mortality tables published by the Society of Actuaries. The change in life expectancy assumptions generally reduced the actuarial present value of the PBO.
During FY2019, pension settlements or pension risk transfer (PRT) programs continued to be employed as a prudent financial cost management tool by plan sponsors. Among the Milliman 100 pension plans, settlement payouts totaled an estimated $13.5 billion in FY2019; down significantly compared to the $18.8 billion in FY2018. The general trend downward may indicate that a majority of the largest U.S. pension plans have already either considered or engaged in PRT programs and now the market has shifted toward employers with smaller plan asset portfolios. The largest settlement in 2019 was $2.7 billion in lump sums paid by GE to former employees who had not yet started their pensions.
Like the Milliman 100 pension plans, the PBGC reported a funding percentage improvement for the corporate pension plans under its custody in the federal fiscal year ending September 30, 2019. The PBGC recorded a 107% funded ratio for the plans that terminated (when the sponsoring employer filed for Chapter 11 insolvency) and were sent to it as the receiving custodian. (We note that plans the PBGC expects to terminate are also included.) This is up from the 102% funded status reported at September 30, 2018. This change was driven by a large increase in assets caused by premiums collected and higher-than-expected investment returns (which exceeded the increase in liability due to the drop in interest rates). Due to the increases in the PBGC premium rates as well as increases in funding deficits in 2018 (as measured on the PBGC’s basis), the PBGC’s total premium income increased by 15% in FY2019 to $6.4 billion, up from $5.5 billion.
Six companies were eliminated in 2019 from our study due to reductions in the market values of pension plan assets or a delay in releasing financial statements.
- Bristol-Myers Squibb terminated their largest pension plan in 2019.
- Weyerhauser assets declined due to a $1.5 billion annuity buyout.
- Baxter International did not release their FY 2019 Form 10-K in time to be included in the 2020 PFS.
- Target, Parker-Hannifin, and Rockwell Automation asset values declined enough to drop below the 100th largest company.
Five companies are new to the 2020 Milliman PFS (some of which returned after falling off in prior years): Kraft-Heinz, AbbVie, Eaton, Alcoa, and Air Products & Chemicals.
Also of note:
- DowDuPont split into three companies: Dow, DuPont, and Corteva (Dow and Corteva both retained a large enough share of DowDuPont’s pension plans to remain in the 2020 study).
- BB&T was renamed Truist as part of its acquisition of SunTrust Banks.
FIGURE 2: HIGHLIGHTS (FIGURES IN $ BILLIONS)
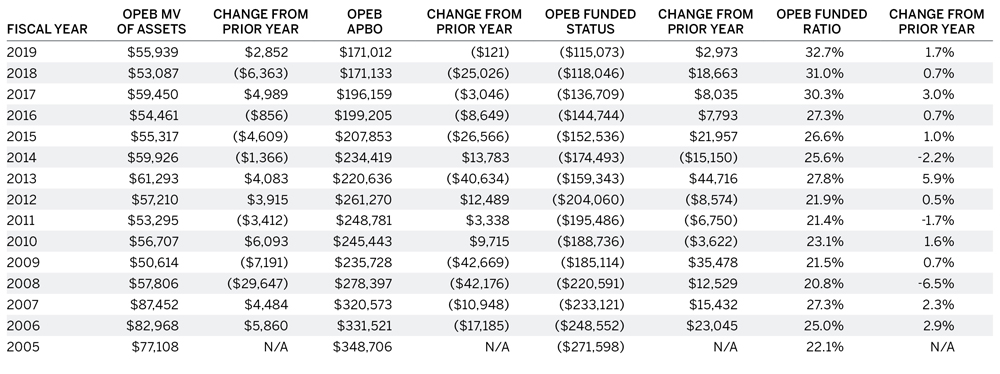
In addition to defined benefit pension plans, the PFS tracks the actuarial obligations of postretirement healthcare benefits. Accumulated postretirement benefit obligations (APBOs) have been trending downward for the past several years. In FY2019, APBOs decreased an additional $0.1 billion from their FY2018 level to $171.0 billion, despite the upward pressure on liabilities due to the large drop in discount rates seen in 2019. This is consistent with the trend by plan sponsors over the last decade of divesting other postemployment benefits (OPEB) liabilities.
The investment return on the pension assets was 17.3% when the expectation was a FY2019 investment return of 6.5%. Based on this, we estimate that there was a net investment gain of $148.8 billion. This is the largest gain we’ve seen in the history of the study. Since 2008, pension plan asset allocations to equities decreased to about 32.5%, from about 43.7%, while fixed income allocation has increased to about 49.1% from about 41.6%.
Contributions in 2019 were $34.0 billion, down significantly from 2018’s $59.5 billion. Pension expense in FY2019 increased by $10.3 billion to $26.5 billion, from $16.2 billion in FY2018.
Detailed comments and illustrations follow in the remainder of the 2020 PFS. Various tables with historical values can be found in the Appendix.
Equities and long duration fixed income both kept pace with liabilities in 2019
With the average discount rate falling by 94 basis points during 2019 for the calendar fiscal year plans, we estimate that their pension liabilities increased approximately 17% on an economic basis (due to the passage of time and changes to discount rates). Plans with significant allocations to fixed income as part of a liability-driven investment (LDI) strategy typically have allocations to long-duration high-quality bonds. During 2019 these bonds earned returns of 20% or more—closely tracking the increase in pension liabilities. Surprisingly, equities, especially U.S. equities, performed even better and also outperformed pension liabilities. Core fixed income produced strong returns but not enough to keep up with the liabilities of most plans.
Rates of return earned in 2019 for the 86 companies sponsoring pension plans with calendar fiscal years ranged from 10.3% to 24.6%, with an average of 18.3%. Returns mostly fell in the 14.0% to 24.0% range (79 plans), with four plans earning returns below 14.0% and three plans earning returns above 24.0%. Generally, plans with greater allocations to equities earned higher returns. The 18 plans with equity allocations of at least 50% earned an average return of 19.6% while the 20 plans with equity allocations below 25% earned an average return of 16.0%. The rate of return earned by the plan sponsor with the highest allocation to equities (71.9%) was 23.4%, which was better than the return of 14.1% for the plan sponsor with the lowest allocation to equities (5.4%) in 2019.
FIGURE 3: ESTIMATED RATES OF RETURN EARNED IN 2019 FOR PLANS BY THEIR ALLOCATION TO EQUITIES (CALENDAR YEAR FISCAL YEARS ONLY)
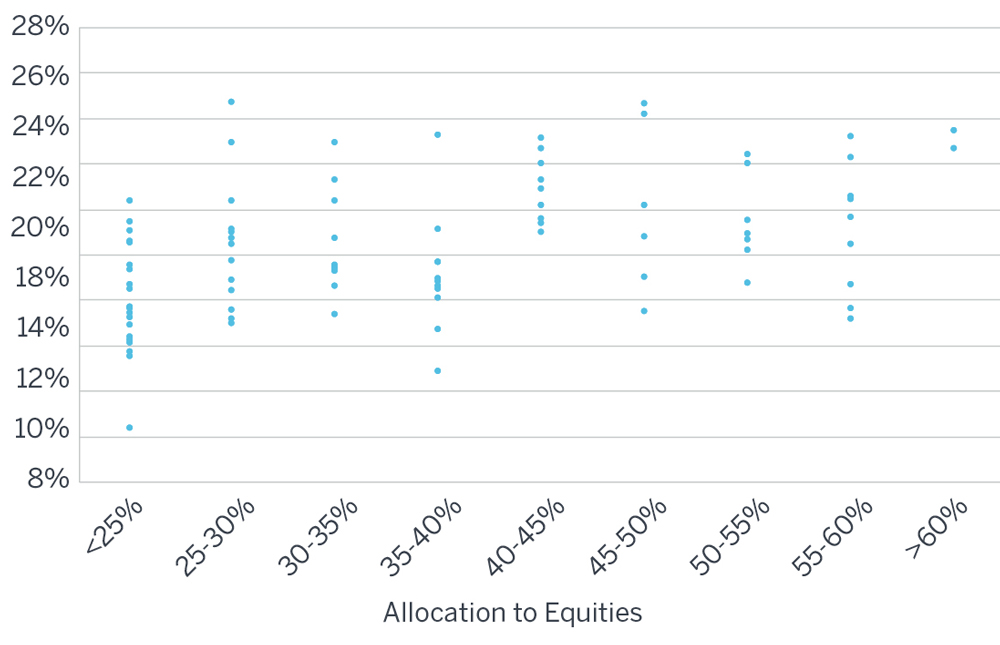
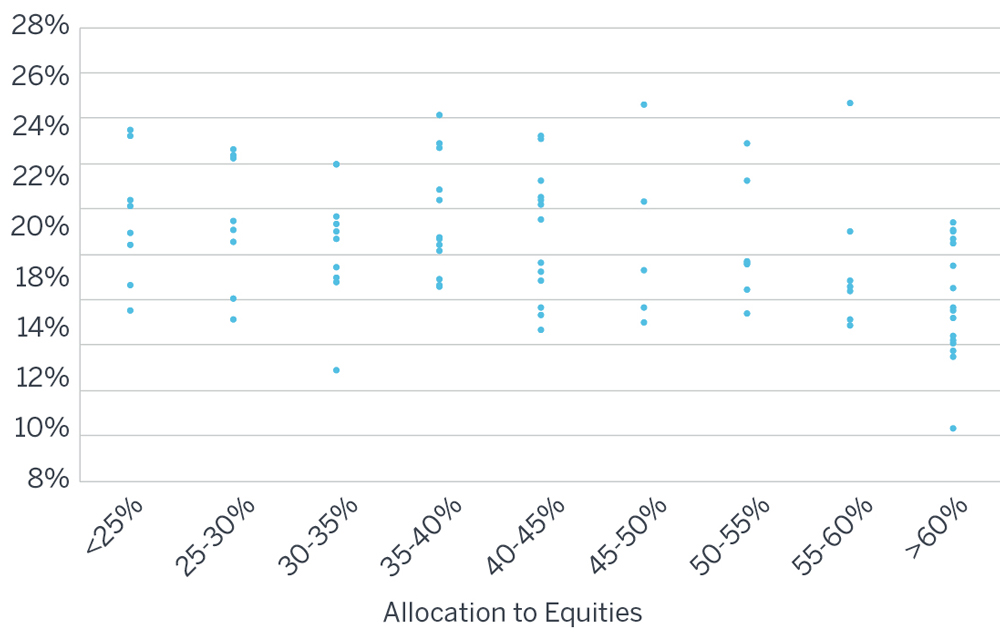
FIGURE 4: ESTIMATED RATES OF RETURN EARNED IN 2019 FOR PLANS BY THEIR ALLOCATION TO FIXED INCOME (CALENDAR YEAR FISCAL YEARS ONLY)
In prior years, investment allocations made by plan sponsors had showed a trend toward implementing LDI strategies. Generally, this involves shifting more assets into fixed income positions. This trend appears to have continued in 2019 as equity allocations in the pension portfolios increased slightly to an average of 32.5% during 2019, up from 32.1% at the end of 2018 (although this may just be due to surging equity prices as opposed to strategic allocation shifts). The percentage of pension fund assets allocated to equities, fixed income, and other investments was 32.5%, 49.1%, and 18.4%, respectively, at the end of FY2019, compared with 32.1%, 48.0%, and 19.9%, respectively, at the end of FY2018.
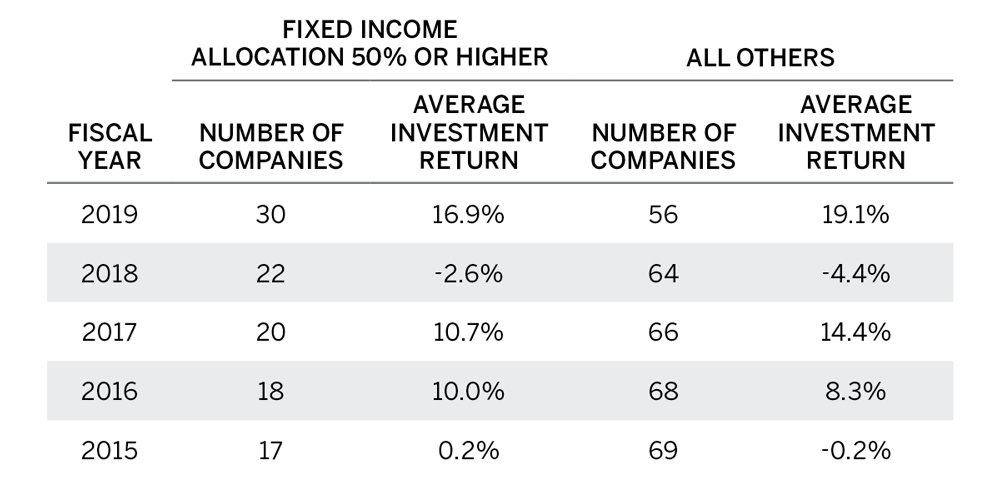
Unlike in FY2018, when plans with high allocations to fixed income (over 50%) outperformed the other plans (-2.6% average return compared with -4.4%), in FY2019 the plans with high allocations to fixed income underperformed the other plans (16.9% compared with 19.1%).
Over the last five years, the plans with consistently high allocations to fixed income have slightly underperformed the other plans while also experiencing lower funded ratio volatility. Among the 86 companies in the Milliman PFS with calendar fiscal years, 26 pension plans had fixed income allocations greater than 40.0% at the end of FY2014 and maintained an allocation of at least 40.0% through FY2019. Over this five-year period, these 26 plans experienced lower funded ratio volatility than the other 60 plans (an average funded ratio volatility of 3.4% versus 4.4% for the other 60 plans) while earning a slightly lower five-year annualized rate of return (an average of 6.6% versus 7.1%). Plans with at least 50% in fixed income have outperformed other plans over three of the last five years.
FIGURE 5: FIXED INCOME ALLOCATION 50% OR HIGHER (CALENDAR YEAR FISCAL YEARS ONLY)
Overall, allocations to equities increased slightly during FY2019, resulting in an average allocation of 32.5%. Only two of the 100 companies had increases to their equity allocations of more than 10.0% in 2019. Five companies decreased their equity allocations by more than 10.0% in 2019, compared with 21 in 2018, one in 2017, four in 2016, five in 2015, 10 in 2014, five in 2013, four in 2012, and 10 in 2011.
Overall allocations to fixed income increased in FY2019, resulting in an average allocation of 49.1%. Only one company had a decrease of more than 10.0% in its fixed income allocation. Eight companies, however, increased their fixed income allocations by more than 10.0% in 2019, compared with 16 in 2018, three in 2017, three in 2016, three in 2015, five in 2014, three in 2013, two in 2012, and six in 2011.
FIGURE 6: ASSET ALLOCATION OVER TIME
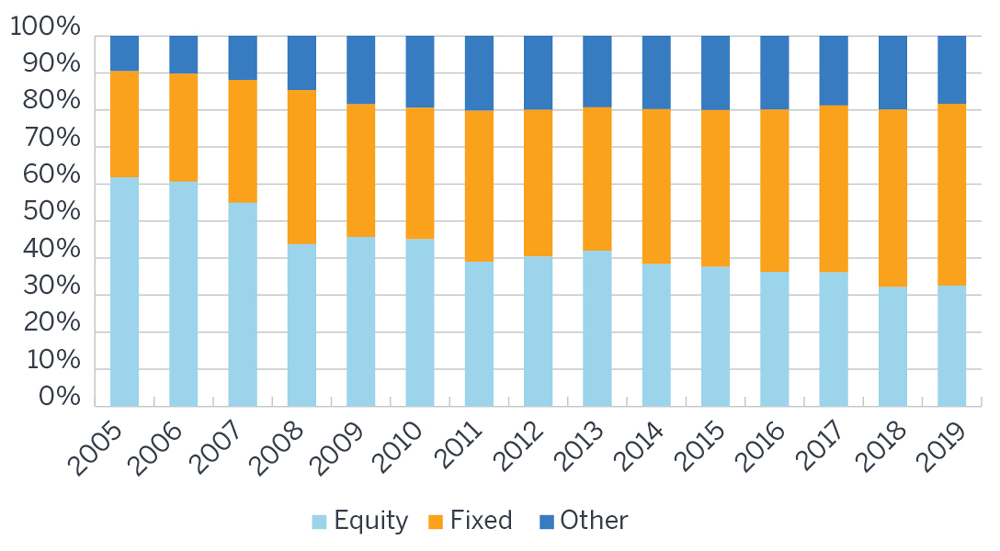
Other asset classes include real estate, private equity, hedge funds, commodities, and cash equivalents. More specific details on how investments are allocated to the other categories are generally not available in the U.S. Securities and Exchange Commission (SEC) filings of the companies. Overall, allocations to other asset classes decreased in FY2019, resulting in an average allocation of 18.4%. Only two companies increased their allocations by 5.0% or more to other asset classes during 2019 while 11 companies decreased their allocation by 5.0% or more.
For comparison purposes, we have looked at historical changes since FY2005, the first year when the Milliman 100 companies consistently made allocation information available. The allocation to equities was down from 61.8% and the allocation to fixed income instruments was up from 28.6% at the end of FY2005. The percentage of investments in other asset classes was also up from the 9.6% allocation at the end of FY2005.
PRT activities continue
Plan sponsors continued to execute PRT activities in FY2019 as a way of divesting pension obligations from their DB plans and corporate balance sheets, although volume for the Milliman 100 companies was down relative to FY2018. Largescale pension buyout programs and lump-sum windows were transacted for four of the Milliman 100 companies as pension assets and liabilities were either transferred to insurance companies or paid out to participants. GE, Lockheed Martin Corporation, PepsiCo, and Ford Motor Company reported total transactions of $2.7 billion, $1.9 billion, $1.3 billion, and $1.3 billion, respectively.
The 2019 PRT market declined when compared with the record high 2018 market. We’ve only been able to estimate the dollar volume of PRT activities from Form 10-K disclosures, and therefore we are unable to be “precise” on the reported dollar volume in FY2019 of $13.5 billion. This decrease of $5.3 billion is compared with the FY 2018 reported dollar volume of $18.8 billion.
PRTs are deemed by plan sponsors to be an effective way to reduce a pension plan’s balance sheet footprint, but generally they have an adverse effect on the plan’s funded status, as assets paid to transfer accrued pension liabilities are higher than the corresponding actuarial liabilities that are extinguished from plans. Much of this incongruity stems from Internal Revenue Service (IRS) pension plan valuation rules differing from an insurance company’s underwriting assessment of these same liabilities.
The Office of PBGC Participant and Plan Sponsor Advocate has stated that the PBGC premiums are a core reason for plan sponsors to divest DB plans. PBGC flat dollar premiums increased to $80 in 2019 from $74 in 2018. The PBGC “variable rate premium” increased to 4.3% of the pension plan’s PBGCfunded status deficit in 2019, from 3.8% of the 2018 deficit. (The PBGC’s funded status deficit uses interest rates and mortality assumptions that are different from those used to determine the funded status of the Milliman 100 companies.)
Reconciliation with January 2020 Milliman 100 PFI
The FY2019 funded ratio of 87.5% was lower than we reported in the January 2020 Milliman 100 Pension Funding Index (PFI). The January 2020 PFI funded ratio of 89.0%, measured as of Dec. 31, 2019, was based on data collected for the 2019 Milliman Pension Funding Study. This revised funded ratio of 87.5% from our current study reflects the collection and collation of more recent publicly available information for companies with fiscal years ending in 2019.
Falling discount rates in FY2019 eroded the funded status, but better-than-expected asset returns dampened the decline
Discount rates used to measure plan obligations, determined by reference to high-quality corporate bonds, decreased during 2019, thereby increasing liabilities. The average discount rate decreased to 3.06% at the end of FY2019 from 4.00% in FY2018. For historical perspective, discount rates have generally declined from the 7.63% reported at the end of FY1999. Over the last decade, discount rate increases have only occurred during three fiscal years (2013, 2015, and 2018).
The increase in the PBO due to the lower discount rates offset the favorable investment returns of 17.3%. The net impact of investment gains, discount rates, contributions, and settlements was relatively little change. The funded ratio improved slightly from 87.1% to 87.5% in FY2019. However, due to the increase of both the assets and liabilities, the funded deficit rose by $16.8 billion in FY2019 from $215.0 billion to $231.8 billion.
FIGURE 7: PENSION SURPLUS/(DEFICIT)
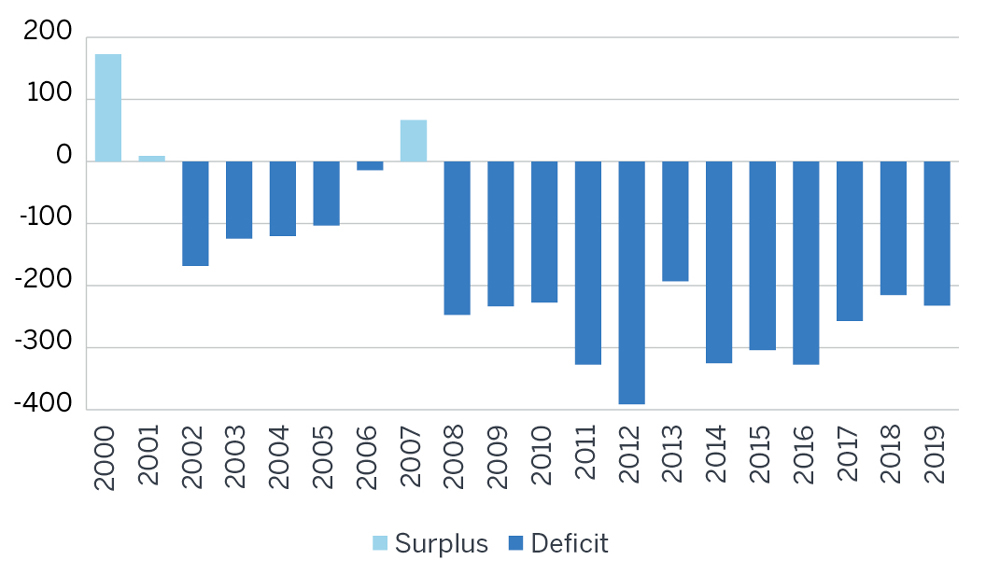
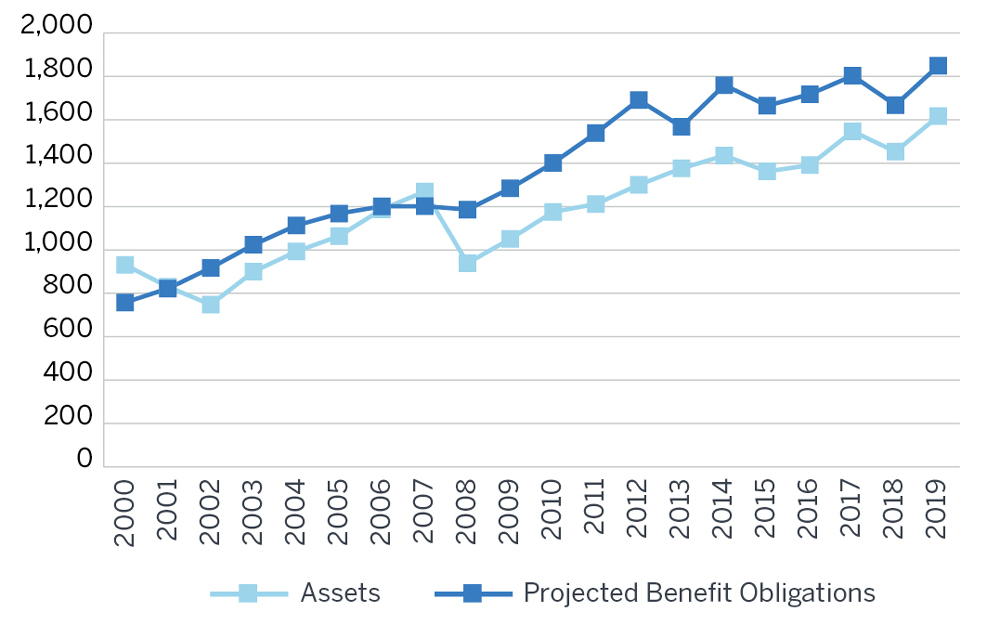
FIGURE 8: PENSION SURPLUS/(DEFICIT): ASSETS AND PBO
The effect of a decrease of 94 basis points in discount rates offset the great investment gains during FY2019.
Pension obligations rose 10.8% in FY2019, the primary driver of which was the decrease in discount rates. This was slightly dampened by the downward pressure on obligations caused by PRT activity and revisions to the life expectancy assumptions used to measure pension plan obligations. The net result was a liability increase of $180.7 billion.
The 17.3% investment return (actual weighted average return on assets during FY2019) resulted in an increase of $163.9 billion in the market value of plan assets after including $34.0 billion in contributions, approximately $13.5 billion paid out in annuity purchases or lump-sum settlements and $95 billion in regular benefit payments. The Milliman 100 companies had set their long-term investment gain expectations to be, on average, 6.5% during FY2019 down from the expectation of 6.6% set for FY2018.
2019 funded ratio barely changes, increases by 0.4%
The funded ratio of the Milliman 100 pension plans increased during FY2019 to 87.5% from 87.1% at the end of FY2018.
Please note that not all of the 100 companies have a fiscal year 2019 that corresponds to calendar year 2019. In order to recognize that difference, we report a funded ratio of 87.5% for the 86 plans with calendar fiscal years in 2019, up from 86.6% for 2018. Fourteen companies have different fiscal year starting dates. Their funded status at the end of FY2019 is 87.4%.
The aggregate pension deficit increased by $7.5 billion during these calendar year companies’ 2019 fiscal years to $211.7 billion, from an aggregate deficit of $204.2 billion at the end of FY2018. For fiscal year 2019, funded ratios (across all 100 companies) ranged from a low of 66.8% for Proctor & Gamble to a high of 142.7% for NextEra Energy, Inc.
FIGURE 9: FUNDED RATIO, ASSETS/PBO
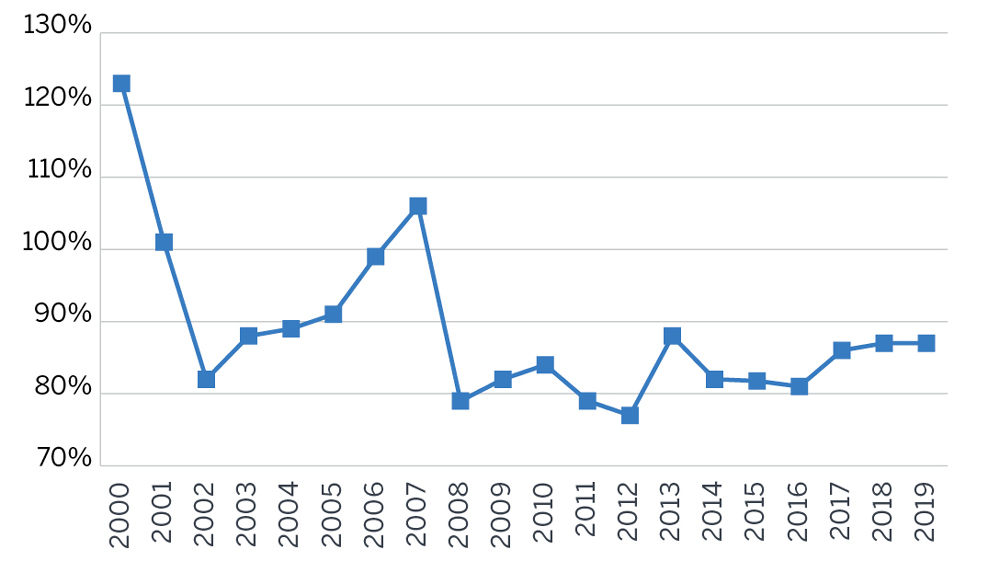
The 0.4% increase in the FY2019 funded ratio added to the improvement seen over the prior two years. Note that there has not been a funding surplus since the 105.6% funded ratio in FY2007.
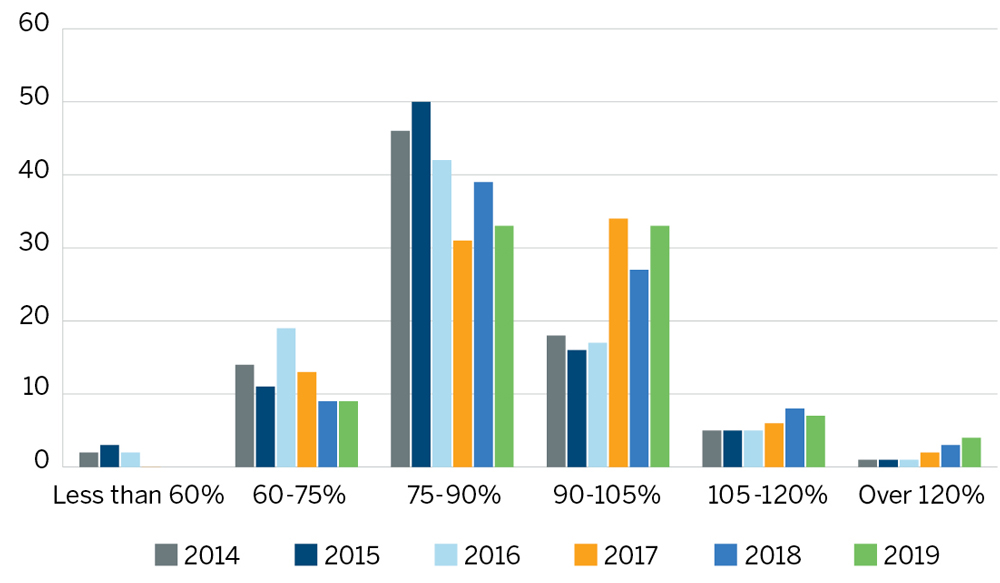
Thirteen of the 86 Milliman 100 companies with calendar fiscal years reported surplus funded status at year-end 2019, compared with 12 companies in 2018, 13 in 2017, eight in 2016, nine in 2015, eight in 2014, and 18 in 2013. These numbers pale in comparison with the 46 companies with reported surplus funded status at year-end 2007. Fifty-four of the Milliman 100 companies with calendar fiscal years reported an increase in funded ratio for 2019, compared with 39 for 2018.
FIGURE 10: DISTRIBUTION BY FUNDED STATUS – 2014-2019 (CALENDAR YEAR FISCAL YEARS ONLY)
FY2019 pension expense increase
There was a net increase in FY2019 pension expense: a $26.5 billion charge to earnings ($10.3 billion higher than in FY2018). This is well below the $56.2 billion peak level in FY2012. Twenty-seven companies recorded FY2019 pension income (i.e., a credit to earnings). Thirty-two companies recorded income in FY2018 and 24 companies in FY2017, up from eight in FY2012.
FIGURE 11: PENSION EXPENSE (INCOME) AND CONTRIBUTIONS
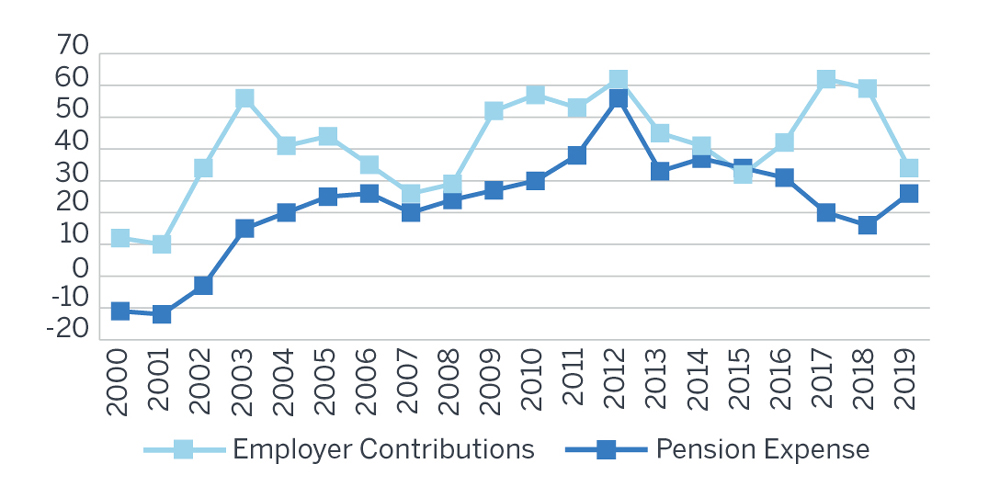
The aggregate 2019 cash contributions of the Milliman 100 companies were $34.0 billion, a decrease of $25.5 billion from the $59.5 billion contributed in 2018, and $27.8 billion less than the 2017 high level of $61.8 billion. Contributions had started to increase in 2016 to $42.2 billion from the amounts contributed in 2015 and 2014 ($31.8 billion and $40.9 billion, respectively).
Pension deficit decreases slightly as a percentage of market capitalization
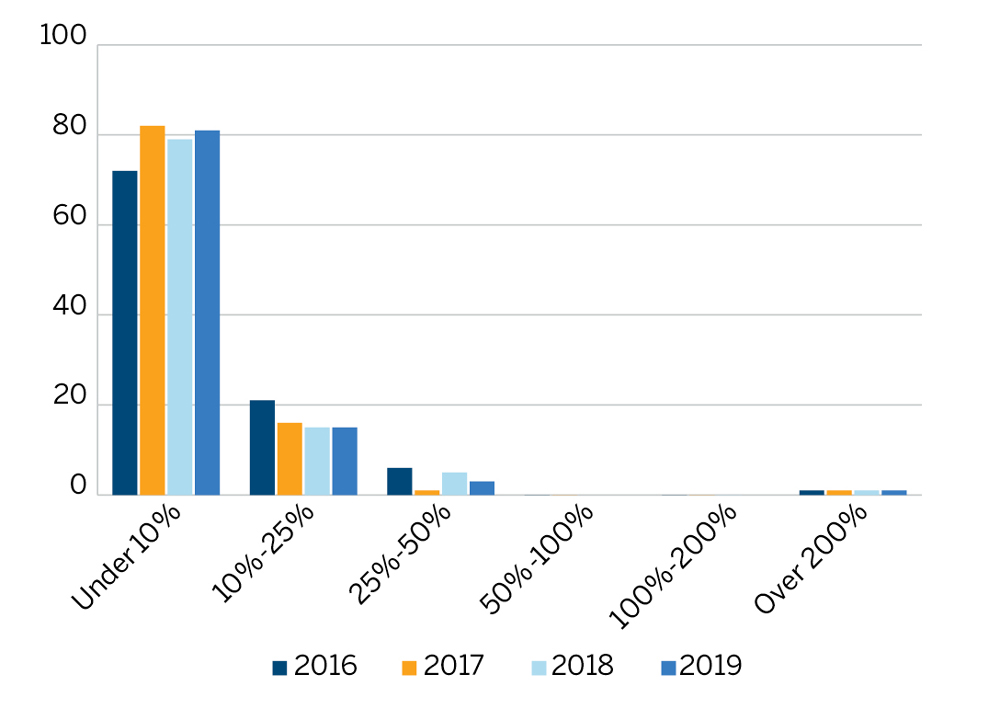
The total market capitalization for the Milliman 100 companies increased by 16.6%. This was mostly offset by the increase in pension obligations (due to higher discount rates), so the net result was only a decrease in the unfunded pension liability as a percentage of market capitalization of 0.3% at the end of FY2019, compared with a decrease of 0.1% at the end of FY2018. Pension deficits represented less than 10.0% of market capitalization for 81 of the Milliman 100 companies in FY2019 and 79 of the Milliman 100 companies in FY2018. This is also an increase from FY2012, when 59 companies had deficits that were less than 10.0% of their market capitalizations.
Since FY2011, these pensions had investment gains exceeding expectations six out of nine years, which has resulted in elevated levels of market capitalization. In FY2019, one company’s plan deficit exceeded 50.0% of market capitalization, down from two companies in FY2015. This is down from nine in FY2012 and FY2011, the year we first started tracking this figure.
FIGURE 12: UNDERFUNDED PENSION LIABILITY AS A PERCENTAGE OF MARKET CAPITALIZATION 2016-2019
Investment performance above expectations
The weighted average investment return on pension assets for the 2019 fiscal years of the Milliman 100 companies was 17.3%, which was above their average expected rates of return of 6.5%. Ninety-six of the Milliman 100 companies exceeded their expected returns in 2019. One company exceeded their expected return in 2018 (it has an off-calendar fiscal year). Ninety-six companies exceeded their expected returns in 2017 and 68 in 2016. However, only three companies exceeded their expected returns in 2015 and all three had off-calendar fiscal years. But 81 companies in 2014 exceeded their expected returns compared with 79 in 2013, 93 in 2012, 22 in 2011, and 97 in 2010.
At the end of FY2019, total asset levels were $1.617 trillion. This is $348 billion above the value of $1.269 trillion at the end of FY2007, prior to the collapse of the global financial markets.
FIGURE 13: INVESTMENT RETURN ON PLAN ASSETS
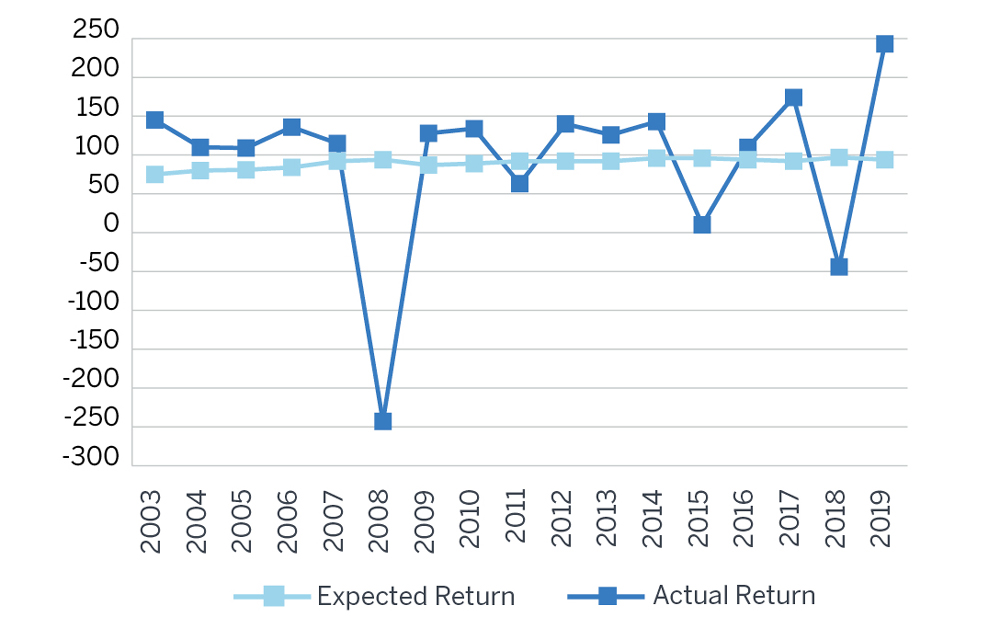
During FY2019, investment gains and contributions were partially offset by annuity purchases, lump-sum settlements and regular benefit payments and increased the market value of assets by $163.9 billion. The Milliman 100 companies’ estimated investment return for FY2019 was $242.5 billion compared with the expected return of $93.7 billion, a difference of $148.8 billion. For the five-year period ending in 2019, investment performance has averaged 6.9% compounded annually (only considering plans with calendar fiscal years). There have only been four years of investment losses over the past 20 years (2001, 2002, 2008, and 2018), contributing to an annualized investment gain of 6.3% over that period (only considering plans with calendar fiscal years).
Expected rates of return
FIGURE 14: SPONSOR-REPORTED ASSUMED RATE OF RETURN ON INVESTMENTS
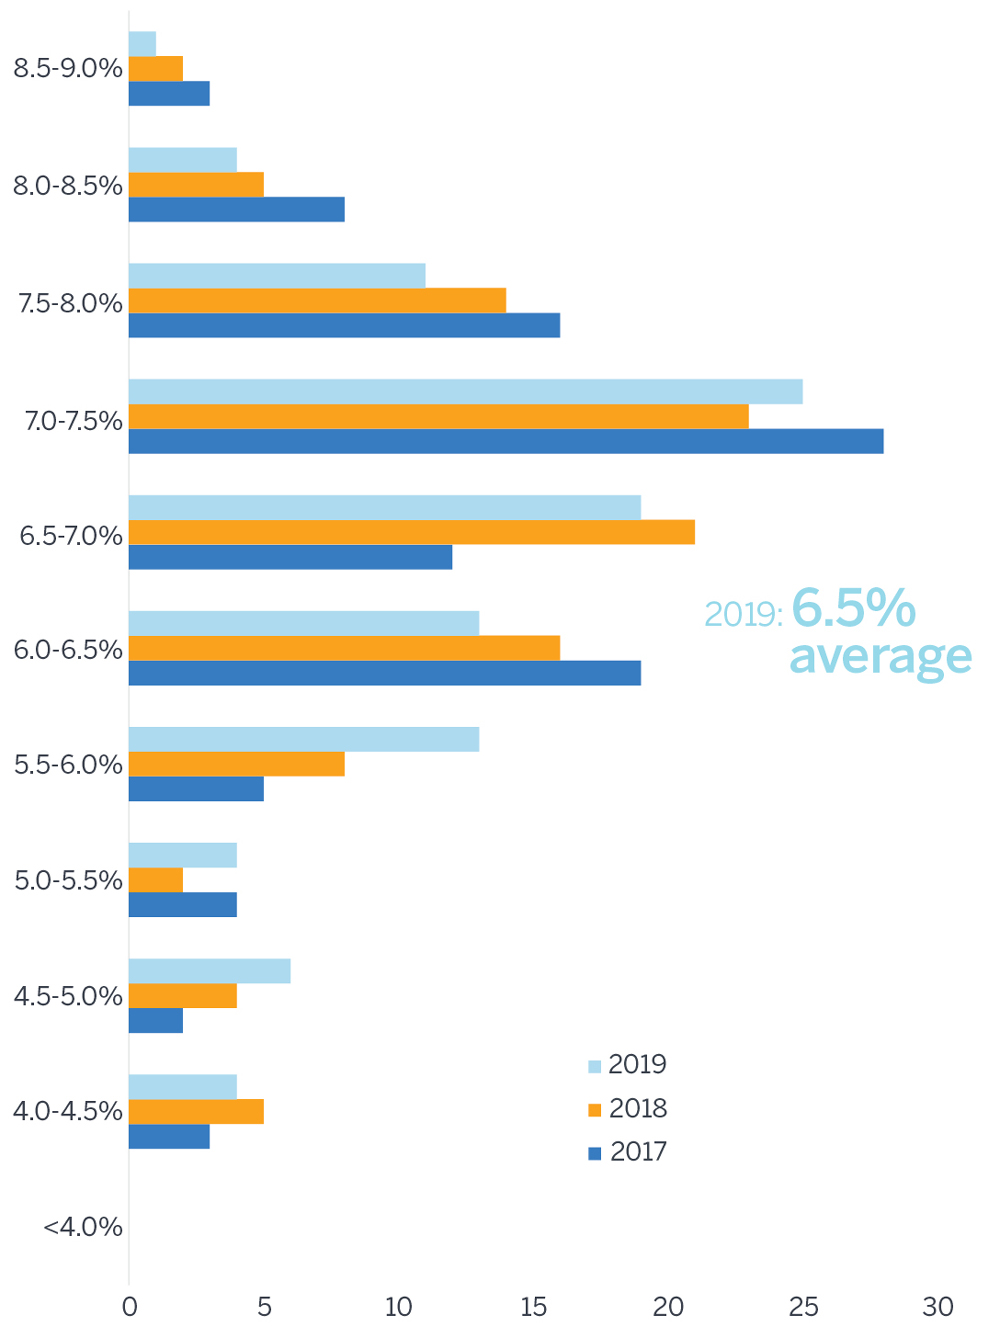
Companies continued to lower their expected rates of return on plan assets to an average of 6.5% for FY2019, as compared with 6.6% for FY2018, 6.8% for FY2017, 7.0% for FY2016, 7.2% for FY2015, 7.3% for FY2014, 7.4% for FY2013, 7.6% for FY2012, 7.8% for FY2011, and 8.0% for FY2010. This represents a significant drop from the average expected rate of return of 9.4% back in FY2000.
Like last year, none of the Milliman 100 companies utilized an expected rate of return for FY2019 of at least 9.0% (the highest was 8.97%). Only two companies had utilized an expected rate of return of at least 9.0% in 2012, 2011, and 2010, but this was down from four in 2009 and a high of 80 in 2000.
What to expect in 2020 and beyond
Our expectations in the coming year include:
- Plan sponsor strategies in response to the Coronavirus Aid, Relief, and Economic Security Act (CARES) and the Setting Every Community Up for Retirement Enhancement (SECURE) Act are just starting. The CARES Act permits a plan sponsor to voluntarily delay contributions to the pension plan until January 1, 2021. The SECURE Act permits a plan sponsor to amend the plan to allow in-service distributions as early as age 59½ as well as changing the Required Minimum Distribution age to 72 from 70½. We will refrain from any predictions due to lack of information from plan sponsors as this report is published in April 2020.
- Plan sponsors who are considering to voluntary defer contributions in 2020 should keep in mind the effect of their decisions on plan funded status, tax deductions, PBGC premiums, and pension expense. The effect on each must be carefully reviewed. Furthermore, with IRS interest rate smoothing provisions expected to partially expire starting in plan years beginning in 2021, plan sponsors need to prepare themselves for the rise in minimum funding requirements in the next several years ahead beyond 2020.
- Plan sponsors will need to consider whether to rebalance or shift asset allocations in light of the falling equity values, rising fixed income prices, and changing capital market assumptions so far in 2020.
- Pension expense for companies with mature plans with primarily inactive liabilities is expected to decrease compared with the FY2019 level. This is due to the investment gains experienced during 2019 as well as the significant drop in discount rates. While the lower discount rates result in higher pension obligations, the net effect will be a lowering of the interest cost components of pension expense.
- On the other hand, for companies with more interest rate sensitivity and thus higher durations of liabilities, the gain from the expected return on assets could be offset by the relative increases in the interest cost and loss amortization components of pension expense. These companies could see increases in pension expense in FY2020 relative to FY2019.
- As employers adapt to the business impact and emerging new realities of the Coronavirus pandemic, the appetite for further pension risk transfer activities such as lump-sum windows and pension lift-outs in 2020 seems low or at best uncertain.
- While PBGC premiums remain a concern for plan sponsors there are many other things to consider in 2020 in light of the already enacted pension relief, the prospect of future relief and our new normal.
HISTORICAL VALUES (All dollar amounts in millions. Numbers may not add up correctly due to rounding.)
FIGURE 15: FUNDED STATUS
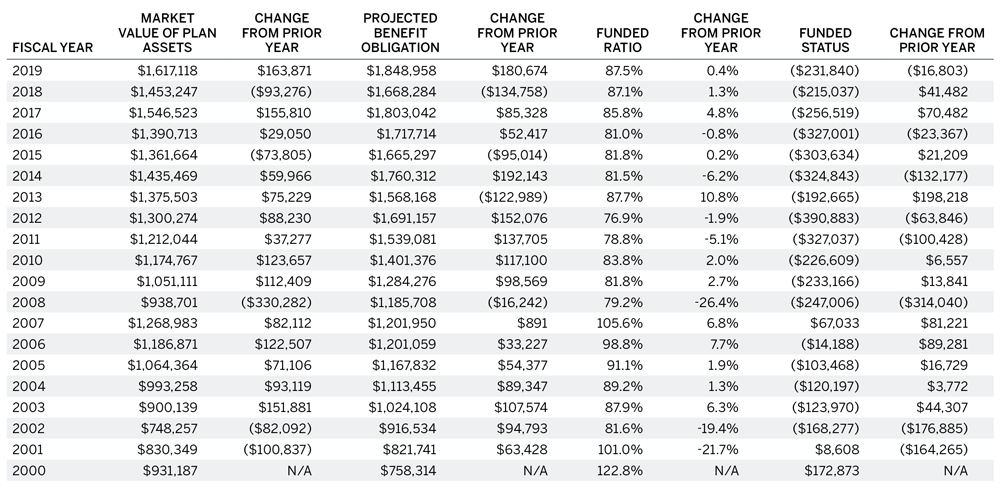
FIGURE 16: RETURN ON ASSETS
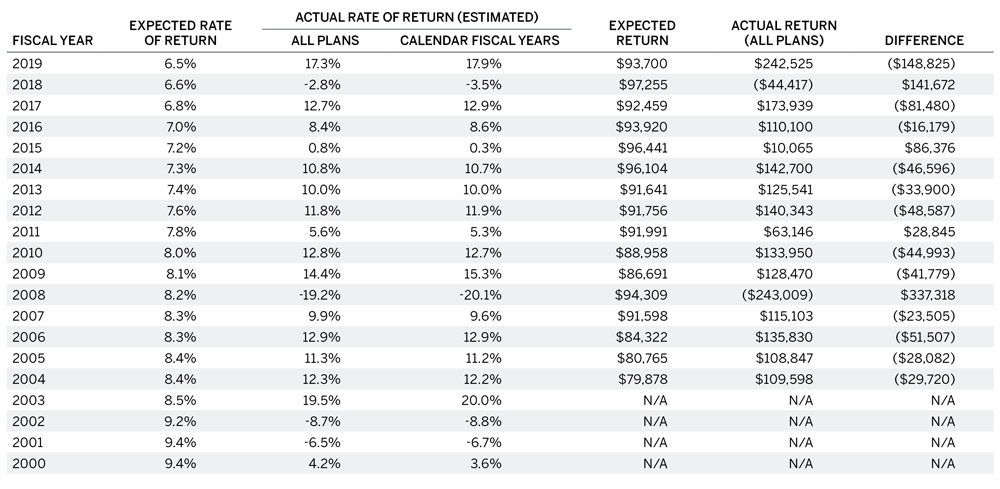
FIGURE 17: PENSION COST
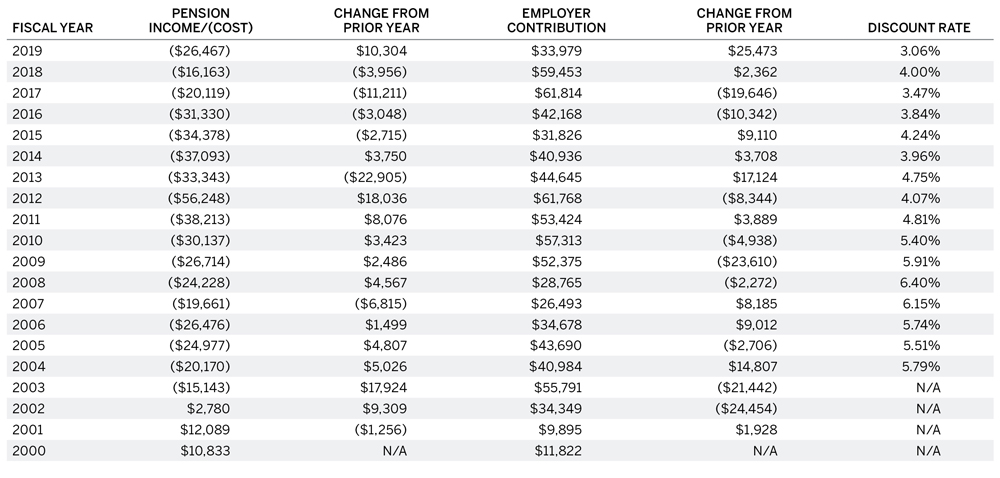
FIGURE 18: ASSET ALLOCATIONS (BY PERCENTAGE)
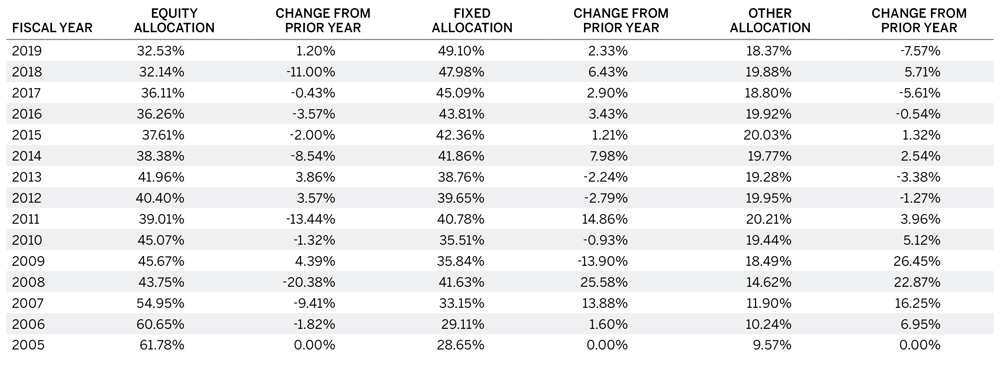
FIGURE 19: PENSION PLAN INFORMATION BY BUSINESS SECTOR
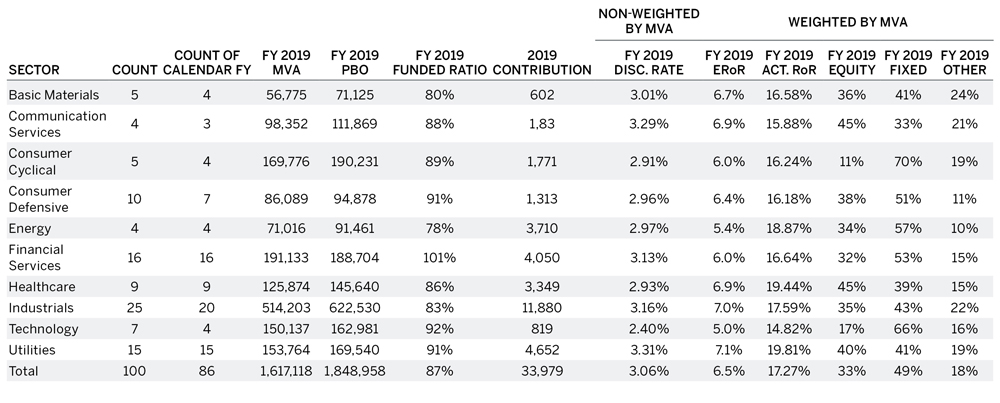
FIGURE 20: OPEB FUNDED STATUS
Who are the Milliman 100 companies?
The Milliman 100 companies are the 100 U.S. public companies with the largest defined benefit (DB) pension plan assets for which a 2019 annual report was released by March 13, 2020.
This 2020 report is Milliman’s 20th annual study. The total value of the pension plan assets of the Milliman 100 companies was more than $1.61 trillion at the end of FY 2019.
About the study
The results of the Milliman 2020 Pension Funding Study (PFS) are based on the pension plan accounting information disclosed in the footnotes to the companies’ Form 10-K annual reports for the 2020 fiscal year and for previous fiscal years. These figures represent the Generally Accepted Accounting Principles (GAAP) accounting information that public companies are required to report under Financial Accounting Standards Board (FASB) Accounting Standards Codification Subtopics 715-20, 715-30, and 715-60. In addition to providing the financial information on the funded status of their U.S. qualified pension plans, the footnotes may also include figures for the companies’ nonqualified and foreign plans, both of which are often unfunded or subject to different funding standards from those for U.S. qualified pension plans. The information, data, and footnotes do not represent the funded status of the companies’ U.S. qualified pension plans under ERISA.
Fourteen of the companies in the 2020 Milliman Pension Funding Study had fiscal years other than the calendar year. The 2020 study includes five new companies to reflect mergers, acquisitions, and other corporate transactions during FY 2019. Figures quoted from 2019 reflect the 2020 composition of Milliman 100 companies and may not necessarily match results published in the 2019 Milliman PFS. Generally, the group of Milliman 100 companies selected remains consistent from year to year. Privately held companies, mutual insurance companies, and U.S. subsidiaries of foreign parents were excluded from the study.
The results of the 2020 study will be used to update the Milliman 100 Pension Funding Index (PFI) as of December 31, 2019, the basis of which will be used for projections in 2020 and beyond. The Milliman 100 PFI is published on a monthly basis and reflects the effect of market returns and interest rate changes on pension funded status.
About the authors
Zorast Wadia, FSA, CFA, EA, MAAA, is a principal and consulting actuary in the New York office of Milliman. He has more than 20 years of experience in advising plan sponsors on their retirement programs. Zorast has expertise in the valuation of qualified and nonqualified plans. He also has expertise in the areas of pension plan compliance, design, and risk management.
Alan H. Perry, FSA, CFA, MAAA, is a principal and consulting actuary in the Philadelphia office of Milliman. He has more than 29 years of experience in advising plan sponsors on asset allocation and financial risk management. Alan specializes in the development of investment policies by performing asset-liability studies that focus on asset mix, liability-driven investing, and risk hedging.
Charles J. Clark, ASA, EA, MAAA, is a principal and director of the employee benefits research group in the Washington, D.C., and New York offices of Milliman. He has over 39 years of experience as a consulting actuary. Charles provides analysis of employee benefits legislation, regulations, and accounting standards to Milliman consultants. He has worked extensively with plan sponsors, Washington, D.C., employee benefits trade groups, and lawmakers on employee benefits program strategy, design, pricing, and interpretation.
Acknowledgments
The authors thank the following Milliman colleagues for their assistance in compiling the figures and editing the report for the Milliman 2020 Pension Funding Study: Shweta Bedi, Amanda Cohen, Keila Cohen, Ryan Cook, Rebecca Driskill, Naman Jain, Jeremy Engdahl-Johnson, Kevin Ferris, Smriti Kohli, Rohan Malik, Jamie Phillips, Palak Tuteja, Divyang Varsani, Mike Wilson, Susan Yearick, and Lynn Yu.