As we open our review of the 2022 PFS, we acknowledge that the national emergency of the pandemic has not yet ended. The pandemic spurred Congress to pass—and President Biden to sign—two new laws in 2021 that contain funding obligation relief for corporate pensions: the American Rescue Plan Act of 2021 (ARPA-21) and the Infrastructure Investment and Jobs Act (IIJA). The laws provide contribution relief by increasing the discount rates for the IRS minimum cash funding calculations until 2035 and allowing any resulting pension deficit to be amortized over 15 years instead of seven years. This created a reduction in the minimum required contributions for those corporate pension sponsors who elected for the relief provisions to first apply in 2021 or retroactively earlier in 2019 or 2020.
Key results for 2021
- The funded percentage increased from 88.1% to 96.3%
- The pension deficit decreased from $236.5 billion to $68.3 billion
- The average return on investments was 8.4%
FIGURE 1: HIGHLIGHTS (IN $ BILLIONS)

FIGURE 2: TOTAL MARKET VALUE OF ASSETS ($ BILLIONS)
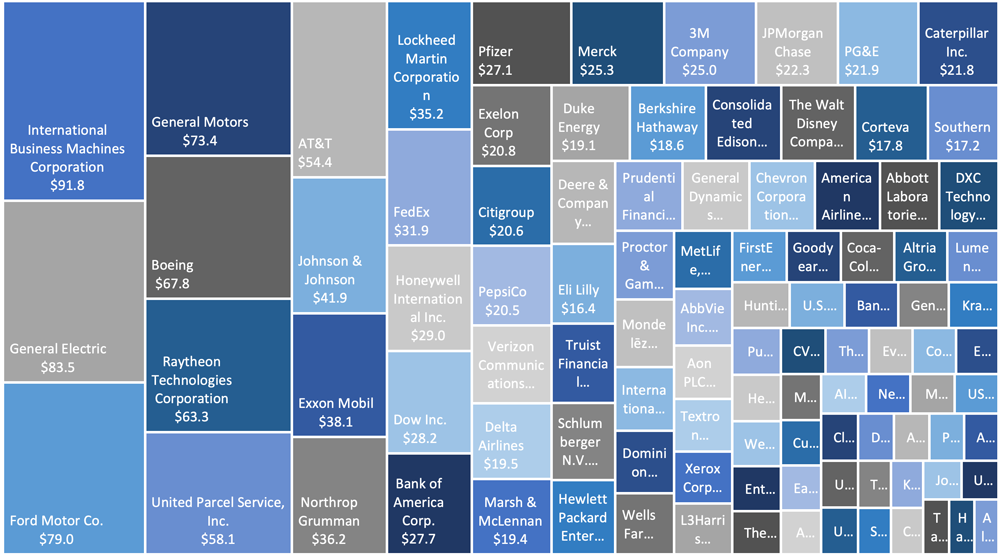
Who are the Milliman 100 companies?
The Milliman 100 companies are the 100 U.S. public companies with the largest defined benefit (DB) pension plan assets for which a 2021 annual report was released by March 11, 2022.
The plans in this study represent employers across multiple business sectors, including communications, healthcare, financial services, industrials, energy, technology, utilities, and others. The total value of the pension plan assets of the Milliman 100 companies was $1.78 trillion at the end of FY2021.
Pension funding overview
An increase in discount rates of 32 basis points along with greater-than-expected investment returns of 8.4% helped the private single-employer DB plans of the Milliman 100 companies continue to reduce the multibillion-dollar pension deficits in 2021. The year-end 2021 funded ratio for the Milliman 100 companies settled at 96.3%, a large improvement from the year-end 2020 funded ratio of 88.1%.
Forty-one plans had a funded ratio of at least 100% compared to 18 plans from last year. In fact, 99 of the 100 companies saw improvements in their funded ratios for their fiscal years ending in 2021 compared to 2020, 31 of which saw increases of 10% or more.
Total plan sponsor contributions of $23.3 billion in 2021 were lower than 2020 contributions of $34.3 billion. These pale in comparison to 2017 and 2018, when plan sponsor contributions hit record highs of $61.5 billion and $59.1 billion, respectively. Five employers contributed at least $1 billion in 2021, down from 10 in 2020. The largest contribution in 2021 was by Chevron Corporation ($1.8 billion). In 2020, the largest was General Electric’s $3.3 billion.
FIGURE 3: DISTRIBUTION BY FUNDED RATIO

Pension funds saw a third consecutive year of better-than-expected investment returns, returning 8.4% in 2021 after returning 13.4% in 2020 and 17.2% in 2019. The 2021 gains increased plan assets by $139 billion compared to the expectation that assets would increase by only $95 billion, based on the companies’ long-term investment return assumptions. Assets of the Milliman 100 plans increased to an all-time high of $1.78 trillion in 2021 from $1.76 trillion in 2020. It is worth noting that, over the 13-year period from 2009 to 2021, there were only three years of adverse investment performance, where returns were less than the expected return assumption. In 2011, the average return was slightly less than expected, in 2015, the average return was near zero, and, in 2018, the average return was negative.
This record asset level was aided by a drop in liability values as the average discount rate increased 32 basis points in 2021, to 2.73% from 2.41%. The pension benefit obligation (PBO) of the Milliman 100 plans decreased to $1.85 trillion from $1.99 trillion.
Pension expense (the charge to the income statement under Accounting Standards Codification Subtopic 715) transformed into an income statement credit of $20.2 billion (pension income of $20.2 billion) in FY2021 from an $18.1 billion charge (pension expense) in FY2020. Prior to FY2021, the last time these pensions reported pension income in aggregate was in FY2002. Other than the anomaly in FY2019, this continues the trend of decreasing expense charges since the all-time high of $56.1 billion in FY2012. In fact, this was a record low pension expense for the study, beating out the income statement credit of $11.9 billion in 2001.
There was a modest increase in life expectancy assumptions; participants and pensioners are expected to live slightly longer than previously assumed based on use of the mortality tables published by the Society of Actuaries (SOA). The change in life expectancy assumptions generally increased the PBO. This is in contrast to the past few years, in which the mortality assumption updates increased the expected rates of deaths, which generally lowered the PBO. However, like prior years, the impact on PBO due to the new mortality tables was generally quite small (some plan sponsors have been referring to it as not even a rounding error). Note that the latest SOA mortality tables are based on mortality data through 2019. It’s still uncertain how the SOA will adjust mortality rates influenced by the “excess deaths” that have occurred during the COVID- 19 pandemic when releasing its next update to the mortality tables in October 2022.
During FY2021, pension settlements or pension risk transfer (PRT) programs continued to be used as financial cost management tools by plan sponsors. The primary types of PRT used were annuity purchases and lump sum windows, but these figures may also include other settlements such as ongoing lump sum payments from plans. Among the Milliman 100 pension plans, settlement payouts totaled an estimated $27.9 billion in FY2021; up from the $15.8 billion in FY2020. Hewlett Packard had the most settlements in 2021, totaling $5.4 billion (most of which was an annuity purchase for its pension plan).
Like the Milliman 100 pension plans, the Pension Benefit Guaranty Corporation (PBGC) reported a large funded status improvement for the corporate pension plans under its custody in the federal fiscal year ending September 30, 2021. The PBGC reported a 126% funded ratio for the plans that terminated (when the sponsoring employer filed for Chapter 11 insolvency) and were sent to the PBGC as the receiving custodian. We note that plans the PBGC expects to terminate are also included. The PBGC funded ratio increased from 112% reported on September 30, 2020. This change was driven by a decrease in liabilities due to increased interest rates and an increase in assets caused by premiums collected, investment income, and credits from actuarial adjustments (e.g., changes to demographic assumptions). Despite the federally mandated increases in the PBGC premium rates, the decreases in funding deficits in 2020 (as measured on the PBGC’s basis) caused the PBGC’s total premium income to decrease by 20% in FY2021 to $4.5 billion, down from $5.7 billion in FY2020.
Two companies were eliminated from our study due to reductions in the market values of pension plan assets during 2021.
- PPL Corporation sold Western Power Distribution (a UK subsidiary) to National Grid PLC (a British company) in 2021. With the sale, National Grid PLC also took over the Western Power Distribution pension plan, leaving PPL Corporation with fewer pension assets than the 100th largest company on our list.
- In 2021, Crown Holdings, Inc. terminated its UK pension plan, leaving Crown Holdings with fewer pension assets than the 100th largest company on our list.
Two companies are new to the 2022 Milliman Pension Funding Study: Cleveland-Cliffs Inc. and United Airlines Holdings (returning after falling off last year).
In addition to DB pension plans, the PFS tracks the actuarial obligations of postretirement healthcare benefits. Accumulated postretirement benefit obligations (APBOs) have been trending downward for the past couple of decades as plan sponsors divest their other postemployment benefits (OPEB) liabilities. In FY2021, this trend continued as APBOs decreased by $16.3 billion to $159.2 billion from their FY2020 level of $175.5 billion.
The investment return on the pension assets was 8.4% when the expectation was a FY2021 investment return of 5.9%. Based on this, we estimate that there was a net investment gain of $44 billion. Since 2008, pension plan asset allocations to equities have decreased to about 29.0%, from about 43.9%, while fixed income allocation has increased to about 51.2% from about 41.7%.
Detailed comments and illustrations follow in the remainder of the 2022 PFS. Various tables with historical values can be found in the Appendix.
Plans that took on asset-liability mismatch risk were rewarded in 2021
With strong returns from equities and alternatives and rising bond yields, plans without significant allocations to fixed income, especially long-duration, generally earned the highest returns.
For calendar-year fiscal year plans (i.e., fiscal years that ended in December 2021), the average discount rate rose by 36 basis points during 2021. We estimate that their pension liabilities decreased approximately 2.3% on an economic basis (due to the passage of time and changes to discount rates, ignoring benefit payments and accruals). Plans with significant allocations to fixed income as part of a liability-driven investment (LDI) strategy typically have allocations to long-duration high-quality bonds. During 2021 these bonds saw asset losses of about 2.5%— closely tracking the decrease in pension liabilities.
FIGURE 4: ESTIMATED RATES OF RETURN EARNED IN 2021 (CALENDAR-YEAR FISCAL YEARS ONLY)

For the 85 companies sponsoring pension plans with calendar-year fiscal years, rates of return in 2021 ranged from 0.8% to 23.5%, with an average of 7.9%. Generally, plans with greater allocations to equities earned higher returns. The 19 plans with equity allocations of at least 50% earned an average return of 11.9% while the 28 plans with equity allocations below 25% earned an average return of 5.2%. Public Service Enterprise Group Inc., which had the highest allocation to equities (71.9%) of any of the companies in the study, earned a rate of return of 14.3%.
In prior years, investment allocations made by plan sponsors had showed a trend toward implementing LDI strategies. Generally, this involves shifting more assets into fixed income positions. This trend appears to have continued in 2021 as fixed income allocations in the pension portfolios increased slightly to an average of 51.2% at the end of FY2021, up from 50.6% at the end of FY2020. The percentage of pension fund assets allocated to equities, fixed income, and other investments was 29.0%, 51.1%, and 19.9%, respectively, at the end of FY2021, compared with 31.9%, 50.6%, and 17.5%, respectively, at the end of FY2020.
As in prior years where equity markets performed well, in FY2021 the plans with higher allocations to fixed income underperformed the other plans (plans with at least 50% allocation to fixed income earned an average return of 4.8% compared with 7.9% overall).
Over the last five years, the plans with consistently high allocations to fixed income have slightly underperformed the other plans while also experiencing lower funded ratio volatility. Among the 85 companies in the Milliman PFS with calendar-year fiscal years, 27 pension plans had fixed income allocations greater than 40.0% at the end of FY2016 and maintained an allocation above 40.0% through FY2021. Over this five-year period, these 27 plans experienced lower funded ratio volatility than the other 58 plans (an average funded ratio volatility of 3.9% versus 5.6% for the other 58 plans) while earning a slightly lower five-year annualized rate of return (an average of 8.4% versus 10.4%). Plans with at least 50% in fixed income have underperformed other plans in four of the last five years.
FIGURE 5: FIXED INCOME ALLOCATION 50% OR HIGHER (CALENDAR-YEAR FISCAL YEARS ONLY)

Overall, allocations to equities decreased slightly during FY2021, resulting in an average allocation of 29.0%. Only two of the Milliman 100 companies had increases to equity allocations of more than 10.0% in FY2021. Nine companies decreased their equity allocations by more than 10.0% in 2021, compared with three in 2020, six in 2019, 21 in 2018, and one in 2017.
Overall allocations to fixed income increased in FY2021, resulting in an average allocation of 51.2%. Two companies had decreases of more than 10.0% to their fixed income allocations. Eleven companies increased their fixed income allocations by more than 10.0% in 2021, compared with two in 2020, nine in 2019, 17 in 2018, and three in 2017.
FIGURE 6: ASSET ALLOCATION OVER TIME

Other asset classes include real estate, private equity, hedge funds, commodities, and cash equivalents. More specific details on how investments are allocated to the other categories are generally not available in the U.S. Securities and Exchange Commission (SEC) filings of the companies. Overall, allocations to other asset classes increased in FY2021, resulting in an average allocation of 19.9%. A total of 10 companies increased their allocations by 5.0% or more to other asset classes during 2021 while two companies decreased their allocations by 5.0% or more.
PRT activities continue
Plan sponsors continued to execute pension risk transfer (PRT) activities in FY2021 as a way of divesting pension obligations from their DB plans and corporate balance sheets, with the volume for the Milliman 100 companies up significantly relative to FY2020. Large-scale pension buyout programs or lump sum windows (with at least $1 billion in settled assets) were transacted for eight of the Milliman 100 companies as pension assets and liabilities were either transferred to insurance companies or paid out to participants. The top three were Hewlett Packard with $5.4 billion, Lockheed Martin Corporation with $4.9 billion, and Alcoa Corporation with $1.8 billion. As described below, these three settlements comprised about 43% of the 2021 PRT activities among the companies in this study.
The 2021 PRT market increased significantly when compared with the 2020 market. For the 2022 PFS we estimate the dollar volume of PRT activities based on Form 10-K disclosures for the 2021 fiscal year to be $27.9 billion, which primarily consisted of annuity purchases and lump sum windows. The estimated FY2021 dollar amount represented an increase of $12.1 billion compared to the FY2020 reported dollar volume of $15.8 billion.
PRTs in the form of buyout programs are deemed by plan sponsors to be an effective way to reduce a pension plan’s balance sheet footprint, but generally they have an adverse effect on the plan’s funded status, as assets paid to transfer accrued pension liabilities are higher than the corresponding actuarial liabilities that are extinguished from plans. Much of this incongruity stems from Financial Accounting Standards Board (FASB) pension plan valuation rules, which differ from an insurance company’s underwriting assessment of the same liabilities.
Reconciliation with January 2022 Milliman 100 PFI
The FY2021 funded ratio of 96.3% was lower than we reported in the January 2022 Milliman 100 Pension Funding Index (PFI). The January 2022 PFI funded ratio of 99.6%, measured as of December 31, 2021, was based on data collected for the 2021 Milliman PFS. The revised funded ratio of 96.3% from our current study reflects the collection and collation of more recent publicly available information for companies with fiscal years ending in 2021. In addition, the PFS funded ratio is aggregating plans with different fiscal year ending dates and different discount rates, whereas the PFI makes normalizing adjustments to approximate the values of all 100 companies as of the same measurement date using the same average discount rate.
Increasing discount rates and solid investment returns together worked to reduce the pension deficit
Discount rates used to measure plan obligations, determined by reference to high-quality corporate bonds, increased during 2021, thereby decreasing liabilities. The average discount rate increased to 2.73% at the end of FY2021 from 2.41% at the end of FY2020. For historical perspective, discount rates have generally declined from the 7.63% reported at the end of FY1999. Over the last decade, discount rate increases have only occurred during four fiscal years (2013, 2015, 2018, and 2021).
The decrease in the PBO due to the higher discount rates combined with the favorable investment returns of 8.4% resulted in a win-win year for plan sponsors. The funded ratio improved significantly from 88.1% to 96.3% in FY2021. The funded deficit decreased in FY2021 from $236.5 billion to $68.3 billion.
FIGURE 7: PENSION SURPLUS/(DEFICIT)

FIGURE 8: PENSION SURPLUS/(DEFICIT): ASSETS AND PBO

Pension obligations decreased 7.1% in FY2021, the primary driver of which was the increase of 32 basis points in discount rates. This was also aided by PRT activity and offset by revisions to the life expectancy assumptions used to measure pension plan obligations. The net result was a liability decrease of $141.6 billion.
The 8.4% investment return (actual weighted average return on assets during FY2021) resulted in an increase of $26.6 billion in the market value of plan assets after including $23.3 billion in contributions, approximately $27.9 billion paid out in annuity purchases or lump sum settlements, and $101.8 billion in regular benefit payments. The Milliman 100 companies had set their long-term investment return expectations to be, on average, 5.9% during FY2021, down from the expectation of 6.2% set for FY2020, and down even further from the 6.5% set in FY2019. These past two years would each on their own represent the largest annual drop in return expectations experienced over the last decade; back-to-back, they show a significant change in investment strategies and market expectations among pension plans.
Funded ratio increases by 8.2%
The funded ratio of the Milliman 100 pension plans increased during FY2021 to 96.3% from 88.1% at the end of FY2020.
Please note that not all the Milliman 100 companies have a fiscal year 2021 that corresponds to calendar year 2021. In order to recognize that difference, we report an aggregated funded ratio of 96.4% for the 85 plans with calendar-year fiscal years in 2021, up from 88.2% for 2020. Fifteen companies have different fiscal year starting dates. Their funded status at the end of FY2021 was 95.3%. We also did not attempt to predict changes in the companies such as mergers or divestitures, but certainly that influenced the funded status change of this diverse group of private employers.
In 2021, the funded ratios of seven companies improved by more than 15%. The plan sponsors with the largest funded ratio increases were Deere & Company (21.3%), Eversource Energy (19.7%), and Delta Airlines (19.4%).
The aggregate pension deficit decreased by $154.0 billion during these calendar-year companies’ 2021 fiscal years to $60.3 billion, from an aggregate deficit of $214.3 billion at the end of FY2020. For FY2021, funded ratios ranged from a low of 70.6% for Proctor & Gamble to a high of 165.1% for NextEra Energy.
FIGURE 9: FUNDED RATIO, ASSETS/PBO

The 8.2% increase in the FY2021 funded ratio added to the improvement seen over the prior four years. Note that there has not been a funding surplus at fiscal year-end since the 105.6% funded ratio in FY2007. The April Milliman 100 Pension Funding Index reported a surplus funded status as of March 31, 2022; it remains to be seen whether this surplus will continue to exist by the end of the year after such a promising start in the first quarter.
Thirty-six of the 85 Milliman 100 companies with calendar-year fiscal years reported surplus funded status at year-end 2021, compared with 15 companies in 2020, 13 in 2019, 12 in 2018, 13 in 2017, eight in 2016, nine in 2015, eight in 2014, and 18 in 2013. This year’s result is getting closer to the 44 companies with reported surplus funded status at year-end 2007. All 85 of the Milliman 100 companies with calendar-year fiscal years reported an increase in funded ratio for 2021, compared with 54 for 2020.
FIGURE 10: DISTRIBUTION BY FUNDED STATUS – 2016-2021 (CALENDAR-YEAR FISCAL YEARS ONLY)

FY2021 pension expense decreases
The FY2021 pension expense flipped to an income statement credit of $18.1 billion ($38.3 billion lower than the $20.2 billion expense in FY2020). This is well below the $56.1 billion expense peak level in FY2012. Fifty-three companies recorded FY2021 pension income (i.e., a credit to earnings). Thirty-nine companies recorded income in FY2020 and 27 companies in FY2019, up from 10 in FY2012.
FIGURE 11: PENSION EXPENSE (INCOME) AND CONTRIBUTIONS

The aggregate 2021 cash contributions by plan sponsors of the Milliman 100 companies were $23.3 billion, a decrease of $11.0 billion from the $34.3 billion contributed in 2020, $10.7 billion less than the $34.0 billion in 2019, $35.8 billion less than the $59.1 billion in 2018, and $38.2 billion less than the 2017 level of $61.5 billion. Contributions had started to increase in 2016 to $42.3 billion from the amounts contributed in 2015 and 2014 ($31.6 billion and $40.7 billion, respectively).
Pension deficit decreases as a percentage of market capitalization
The total market capitalization for the Milliman 100 companies increased by 26.5%. The total pension deficit decreased by 71.1%, so the net result was a decrease in the unfunded pension liability as a percentage of market capitalization to 0.7% at the end of FY2021 compared with 3.0% at the end of FY2020 and 2.7% at the end of FY2019. Pension deficits represented more than 10.0% of market capitalization for six of the Milliman 100 companies in FY2021, down from 24 of the companies in FY2020. This is a substantial decrease from FY2012, when 40 of the companies had deficits that were more than 10.0% of their market capitalizations.
Since FY2011, we have had investment gains exceeding expectations in eight out of 10 years, which could have contributed to elevated levels of market capitalization. In FY2021, one company’s plan deficits exceeded 50.0% of market capitalization. This is down from nine in FY2011, the year we first started tracking this figure.
FIGURE 12: UNDERFUNDED PENSION LIABILITY AS A PERCENTAGE OF MARKET CAPITALIZATION 2018-2021

Investment performance exceeds expectations
The weighted average investment return on pension assets for the 2021 fiscal years of the Milliman 100 companies was 8.4%, which was above their average expected rates of return of 5.9%. Seventy-six of the Milliman 100 companies exceeded their expected returns in 2021, compared to 96 in 2020. It is worth noting that over the 12 years since the global financial crisis, only three years resulted in adverse investment performance where returns were below expectations.
At the end of FY2021, total asset levels were $1.783 trillion. This is $527 billion above the value of $1.256 trillion at the end of FY2007, prior to the collapse of the global financial markets.
FIGURE 13: INVESTMENT RETURN AMOUNTS IN $BILLION ON PLAN ASSETS

During FY2021, investment gains and contributions were partially offset by annuity purchases, lump sum settlements, and regular benefit payments, increasing the market value of assets by $26.6 billion. The Milliman 100 companies’ estimated investment return for FY2020 was $139.0 billion compared with the expected return of $95.4 billion. For the five-year period ending in 2021, investment performance has averaged 9.5% compounded annually (only considering plans with calendar year fiscal years). There have only been four years of negative investment returns over the past 22 years (2001, 2002, 2008, and 2018), contributing to an annualized investment gain of 6.8% over that period (again, only considering plans with calendar-year fiscal years).
Expected rates of return
FIGURE 14: SPONSOR-REPORTED ASSUMED RATE OF RETURN ON INVESTMENTS

Companies continued to lower their expected rates of return on plan assets to an average of 5.9% for FY2021, as compared with 6.2% for FY2020, 6.5% for FY2019, 6.6% for FY2018, 6.8% for FY2017, 7.0% for FY2016, 7.2% for FY2015, 7.3% for FY2014, 7.4% for FY2013, 7.6% for FY2012, 7.8% for FY2011, and 8.0% for FY2010. This represents a significant drop from the average expected rate of return of 9.4% back in FY2000.
Four of the Milliman 100 companies utilized an expected rate of return for FY2021 of at least 8.0% (the highest was 8.98% for Delta Airlines). This differs drastically from FY2000, in which all but two companies were above 8.0% (the highest was 10.90%).
Pension funding in 2022 and beyond
The start of 2022 has been a turbulent one both economically and politically; from war in Eastern Europe to stock market declines, skyrocketing inflation, and the Great Resignation, employees and employers are grappling with a number of challenges. Our expectations for pension funding in the coming year include:
- Reductions in plan sponsor contributions are likely, given the funding relief provisions included in the American Rescue Plan Act of 2021 (ARPA-21) and Infrastructure Investments and Jobs Act (IIJA).
- Pension expense is expected to decrease compared with the FY2021 level but the decrease will likely not be as large as seen during FY2021. This is due to the investment gains experienced during 2021 as well as the significant rise in discount rates. There will likely be an offset in the interest cost, which may increase for mature plans due to the rise in discount rates. Furthermore, the expected return on assets component of pension expense in 2022 is expected to be lower than that in 2021, given the lower expected plan contributions and lower expected return assumptions for the Milliman 100 companies.
- As the Federal Reserve raises interest rates to combat inflation levels not seen in 40 years, the financial markets are likely to see significant fluctuations. However, any increases to interest rates will only direct raise the short end of the yield curve. Pension plans typically have longer time horizons and are more impacted by long-term yields. These factors tend to be driven more by inflation expectations and economic growth.
- Long-term yields are already on the rise in the first quarter of 2022, which results in higher pension discount rates. Rising discount rates will have the effect of increasing the funding ratio and pension surplus of the Milliman 100 companies. Should 2022 end with a surplus, this will be the first time since the fiscal year ending in 2007.
- With ARPA-21 in full effect, we may see more investment de-risking as plan sponsors pursue less risky investment strategies given the longer cost amortization periods allowed.
- Given the funding relief provisions under ARPA-21 and IIJA, the market declines experienced in the first quarter of 2022, and the prospect of worsening inflation, the appetite for significant pension risk transfer activities such as lump sum windows and pension buyouts in 2022 seems low or at best uncertain.
Appendix
HISTORICAL VALUES (All dollar amounts in millions. Numbers may not add up correctly due to rounding.)
FIGURE 15: FUNDED STATUS

FIGURE 16: RETURN ON ASSETS

FIGURE 17: PENSION COST

FIGURE 18: ASSET ALLOCATIONS (BY PERCENTAGE)

FIGURE 19: PENSION PLAN INFORMATION BY BUSINESS SECTOR

FIGURE 20: OPEB FUNDED STATUS

About the study
The results of the Milliman 2022 Pension Funding Study (PFS) are based on the pension plan accounting information disclosed in the footnotes to the companies’ Form 10-K annual reports for the 2021 fiscal year and for previous fiscal years. These figures represent the GAAP accounting information that public companies are required to report under Financial Accounting Standards Board (FASB) Accounting Standards Codification Subtopics 715-20, 715-30, and 715-60. In addition to providing the financial information on the funded status of their U.S. qualified pension plans, these footnotes may also include figures for the companies’ nonqualified and foreign plans, both of which are often unfunded or subject to different funding standards from those for U.S. qualified pension plans. These foreign and nonqualified plans are included in our study, so the information, data, and footnotes do not represent the funded status of only the companies’ U.S. qualified pension plans under ERISA.
Fifteen of the companies in the 2022 Milliman Pension Funding Study had fiscal years other than the calendar year. The 2022 study includes two new companies to reflect mergers, acquisitions, and other corporate transactions during FY2021. Figures quoted from 2021 reflect the 2022 composition of Milliman 100 companies and may not necessarily match results published in the 2021 Milliman PFS. Generally, the group of Milliman 100 companies selected remains consistent from year to year. Privately held companies, mutual insurance companies, and U.S. subsidiaries of foreign parents were excluded from the study.
The results of the 2022 study will be used to update the Milliman 100 Pension Funding Index (PFI) as of December 31, 2021, the basis of which will be used for projections in 2022 and beyond. The Milliman 100 PFI is published on a monthly basis and reflects the effect of market returns and interest rate changes on pension funded status.
About the authors
Zorast Wadia, FSA, CFA, EA, MAAA, is a principal and consulting actuary in the New York office of Milliman. He has more than 20 years of experience in advising plan sponsors on their retirement programs. Zorast has expertise in the valuation of qualified and nonqualified plans. He also has expertise in the areas of pension plan compliance, design, and risk management.
Alan H. Perry, FSA, CFA, MAAA, is a principal and consulting actuary in the Philadelphia office of Milliman. He has more than 30 years of experience in advising plan sponsors on asset allocation and financial risk management. Alan specializes in the development of investment policies by performing assetliability studies that focus on asset mix, liability-driven investing, and risk hedging.
Charles J. Clark, ASA, EA, MAAA, is a principal and director of the employee benefits research group in the Washington, D.C., and New York offices of Milliman. He has over 40 years of experience as a consulting actuary. Charles provides analysis of employee benefits legislation, regulations, and accounting standards to Milliman consultants. He has worked extensively with plan sponsors, Washington, D.C., employee benefits trade groups, and lawmakers on employee benefits program strategy, design, pricing, and interpretation.
Acknowledgments
The authors thank the following Milliman colleagues for their assistance in compiling the figures and editing the report for the Milliman 2022 Pension Funding Study: Lena Amano, Tristine Baccam, Shweta Bedi, Kunal Bhardwaj, Amanda Cohen, Keila Cohen, Ryan Cook, Rebecca Driskill, Greg Duncan, Jeremy Engdahl-Johnson, Kevin Ferris, Pratik Hemani, Mirella Lugo, Jamie Phillips, Javier Sanabría, Namitha Shetty, Kyle Wood, and Lynn Yu.