This is an update to the Milliman 2027 IRS Limits Forecast using the U.S. Bureau of Labor Statistics (BLS) report published July 14, 2026.
Our initial forecast in March 2026 can be found here. It includes information about the limits for qualified retirement plans, how these limits are calculated, and why they may be relevant for certain plan sponsors.
June 2026 forecast
Our limits forecast is projected using two assumption sets. One set is based on the current trailing 12 months of the Consumer Price Index (CPI), and the second assumes that year-to-date CPI (since September 30, 2025) will continue to increase each month through September 30, 2026, by an estimated 25 basis points (3.0% annual).
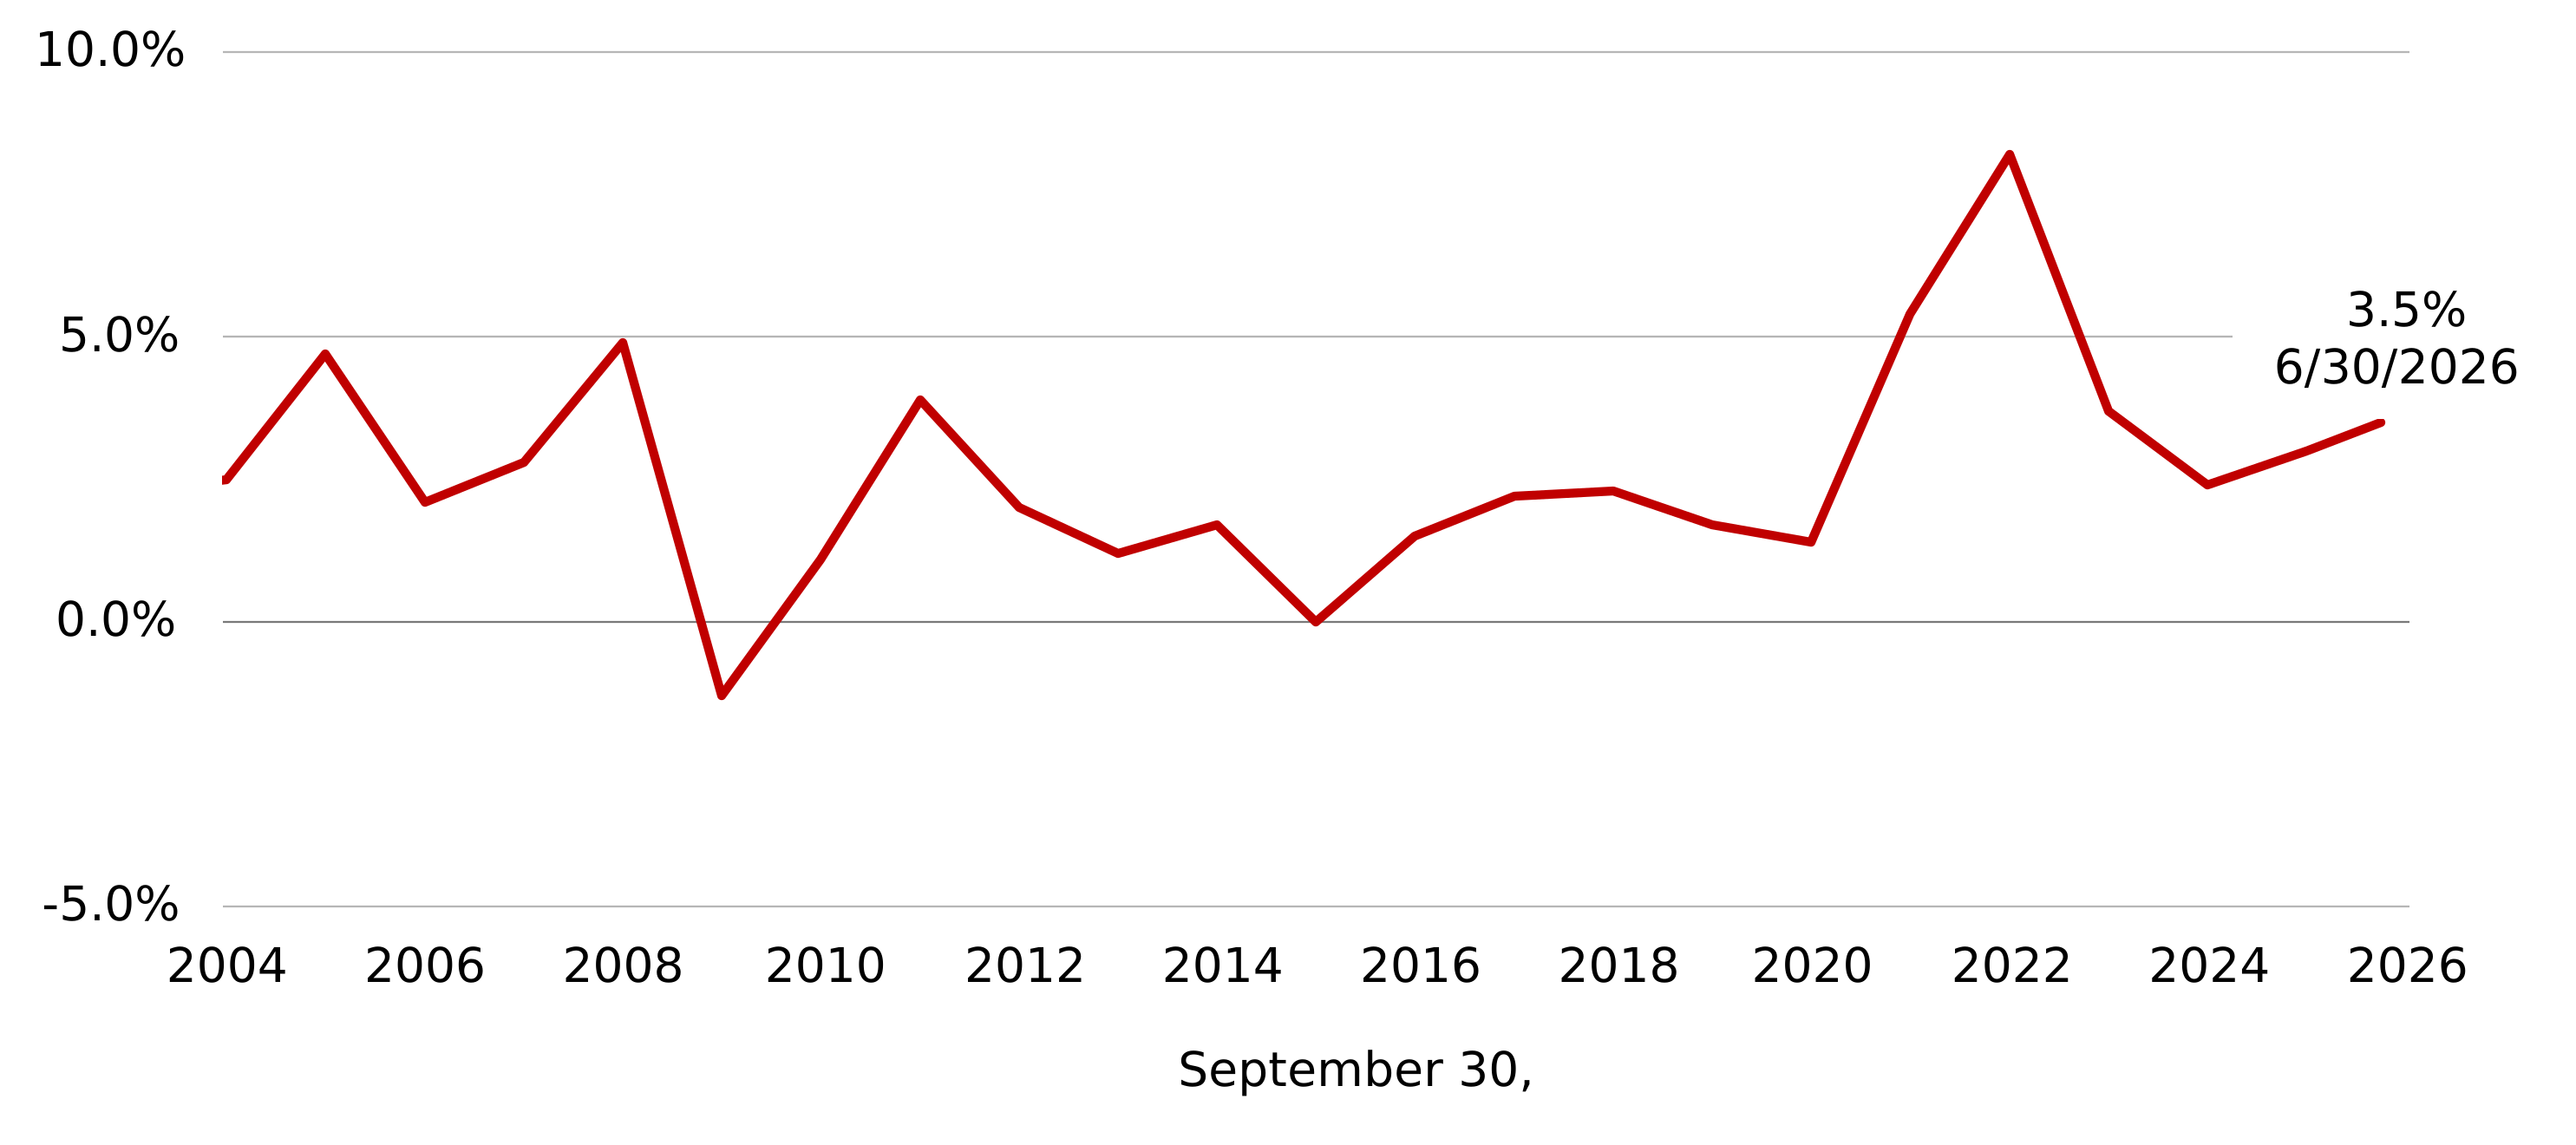
Historical rolling 12-month changes in the CPI as of each September 30 through 2025, and the current trailing 12-month change through June 30 of the current federal fiscal year (FFY), are shown in Figure 1.
Figure 1: Historical 12-month percentage change each September 30 and current trailing 12-month percentage change through June 30, Consumer Price Index, all items, not seasonally adjusted
Source: U.S. Bureau of Labor Statistics.
The CPI as reported by the BLS for the 12 months ended June 30, 2026, was 3.5%, down from 4.2% for the 12 months ended May 31, 2026, but higher than the 3.0% annual change in the CPI as of September 30, 2025 (i.e., the close of the prior FFY). It is also higher than the 3.2% average annual change over the past 10 years ended September 30, 2025, and higher than the 2.5% average annual change over the past 20 years ended September 30, 2025.
Since September 30, 2025, the CPI has increased about 2.8%. Projecting monthly increases of 0.25% through September 2026 results in an estimated annual increase factor of 3.6% for our 9-month actual/3-month forecast projection.
Figure 2 shows the limits forecasted under both assumption sets. Values that changed from the May forecast are in bold.
As previously noted, one of our projection scenarios assumes that CPI increases 0.25% per month through September (i.e., about 0.75% for the next three months). To gauge how sensitive our projected limits are, we calculated the smallest CPI changes for July through September 2026 that would cause the estimated compensation or contribution limits to move up or down relative to this June forecast. The results are shown below (using the IRS rounding rules).
| Change in CPI for July through September 2026 | Change in estimated 2027 IRS limits |
|---|---|
| Increase of about 0.57% per month, i.e., about 1.72% for three months | A $5,000 increase in the compensation limit and $1,000 increase in the maximum annual addition for defined contribution (DC) plans compared to the June forecast |
| Decrease of about 0.10% per month, i.e., about 0.29% for three months | A $5,000 decrease in the compensation limit and $1,000 decrease in the maximum annual addition for defined contribution (DC) plans compared to the June forecast. In addition, all of the other limits also decrease from the June forecast, except for the super catch-up contributions (ages 60–63), the contribution limit to emergency savings accounts (ESAs), and the prior-year wage threshold triggering Roth catch-up contributions to DC plans. |
The BLS is expected to release the July CPI results on August 12, 2026, at which time this forecast will be updated.
Please contact your Milliman consultant for details and questions about how these limits apply to your retirement plan(s).
Figure 2: 2027 IRS Limits Forecast using actual FFY 2026 Consumer Price Index (CPI) as of June 30, 2026
| Category of annual IRS limits | 2026 IRS limits | Estimated 2027 IRS limits | Dollar increases from 2026 limit | ||
|---|---|---|---|---|---|
| Actual 12-month trailing Consumer Price Index (CPI) as of 6/30/2026 | 9-month actual 6/30/2026, 3 months forecast to 9/30/2026 | Actual 12-month trailing Consumer Price Index (CPI) as of 6/30/2026 | 9-month actual 6/30/2026, 3 months forecast to 9/30/2026 | ||
| Maximum annual annuity pension for DB plans | $290,000 | $300,000 | $300,000 | $10,000 | $10,000 |
| Maximum annual addition for DC plans | $72,000 | $75,000 | $75,000 | $3,000 | $3,000 |
| Maximum §401(k), §403(b), §457 deferral for DC plans | $24,500 | $25,500 | $25,500 | $1,000 | $1,000 |
| Catch-up contribution limit for DC plans | $8,000 Ages 60 to 63: $11,250 |
$8,500 Ages 60 to 63: $11,750 |
$8,500 Ages 60 to 63: $11,750 |
$500 $500 |
$500 $500 |
| Compensation limit | $360,000 | $375,000 | $375,000 | $15,000 | $15,000 |
| HCE dollar amount | $160,000 | $170,000 | $170,000 | $10,000 | $10,000 |
| Key employee/officer compensation | $235,000 | $245,000 | $245,000 | $10,000 | $10,000 |
| Contribution limit to ESAs for DC plans | $2,600 | $2,700 | $2,700 | $100 | $100 |
| Prior-year wage threshold triggering Roth catch-up contributions to DC plans | $150,000 | $155,000 | $155,000 | $5,000 | $5,000 |
| Domestic abuse withdrawal limit | $10,500 | $10,900 | $10,900 | $400 | $400 |
Source: https://www.bls.gov/cpi/ retrieved July 14, 2026.
Actual 12-month trailing Consumer Price Index (CPI) for All Urban Consumers (CPI-U) of 3.5% ending June 30, 2026.
Actual 9-month CPI-U ending June 30, 2026, and 0.25% per month for July through September 2026.