According to the Bureau of Labor Statistics, private-sector employers spent nearly 30% of employee compensation costs on benefits in December 2024. With this significant investment, it’s vital for companies to understand how workers are engaging with health and welfare plans to ensure employees understand and take full advantage of offerings—and employers concentrate their benefit dollars on programs their employees need.
Enrollment data can be a valuable source of information about how well a benefits strategy is working. This paper explores how to use enrollment data to surface insights and to design benefit programs and messaging aligned with company goals and employee priorities, including:
- Key enrollment metrics to watch
- What metrics can reveal about employee benefits challenges and successes
- How to transform benefits enrollment data into actionable HR insights
Key enrollment metrics relevant to employee benefits strategy and engagement
Enrollment engagement metrics can reveal how well employees understand and interact with a benefits plan. Enrollment metrics can include:
- Enrollment engagement rates
- Web activity
- Email open and click-through rates
- Enrollment migration reports by benefit type
- Customer service metrics
Enrollment engagement rates
At the most basic level, general statistics on enrollment show how engaged employees are with their benefits program. Figure 1 shows an example of enrollment data.
Figure 1: Enrollment data
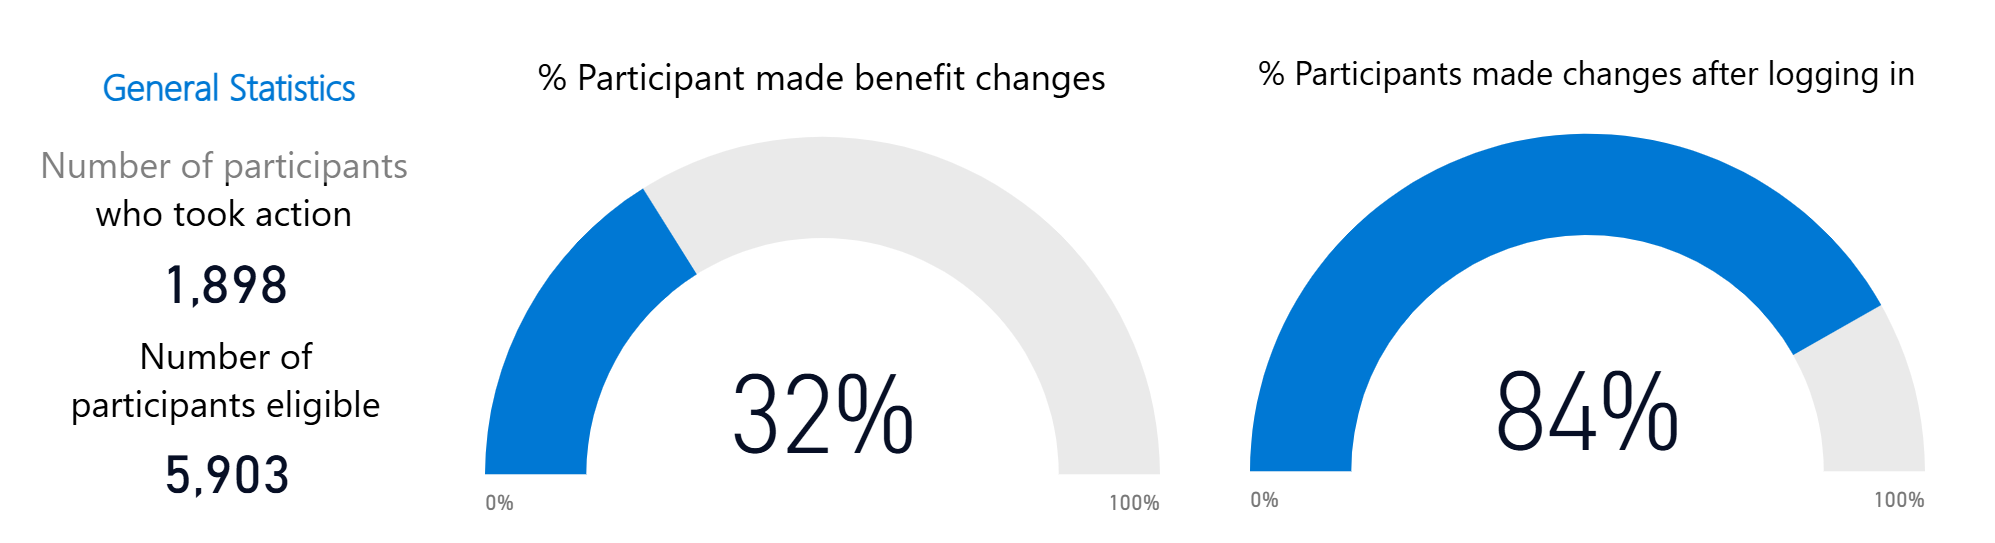
In this example, the first metric is the number of participants who took action. This is expressed as a percentage of people who made benefit changes out of all eligible participants. High rates suggest that communication efforts are effective and that employees are aware of the enrollment period, while low log-in rates may indicate a need to improve outreach and communication strategies.
It is also important to monitor the percentage of employees making benefit changes after logging in. This can signal shifts in employee priorities or satisfaction with current benefits. If there is a low conversion rate from log-ins to changes, it may indicate either confusion about or satisfaction with current benefits.
Understanding these metrics is important because they reflect overall employee engagement and awareness of the enrollment period. They also show how responsive employees are to the benefits offerings and any changes in their needs. Additionally, these metrics help show how many employees are actively managing their benefits after reviewing their options.
Web activity metrics
Employers also need to carefully monitor web activity during the enrollment period, as shown in Figure 2.
Figure 2: Web activity metrics
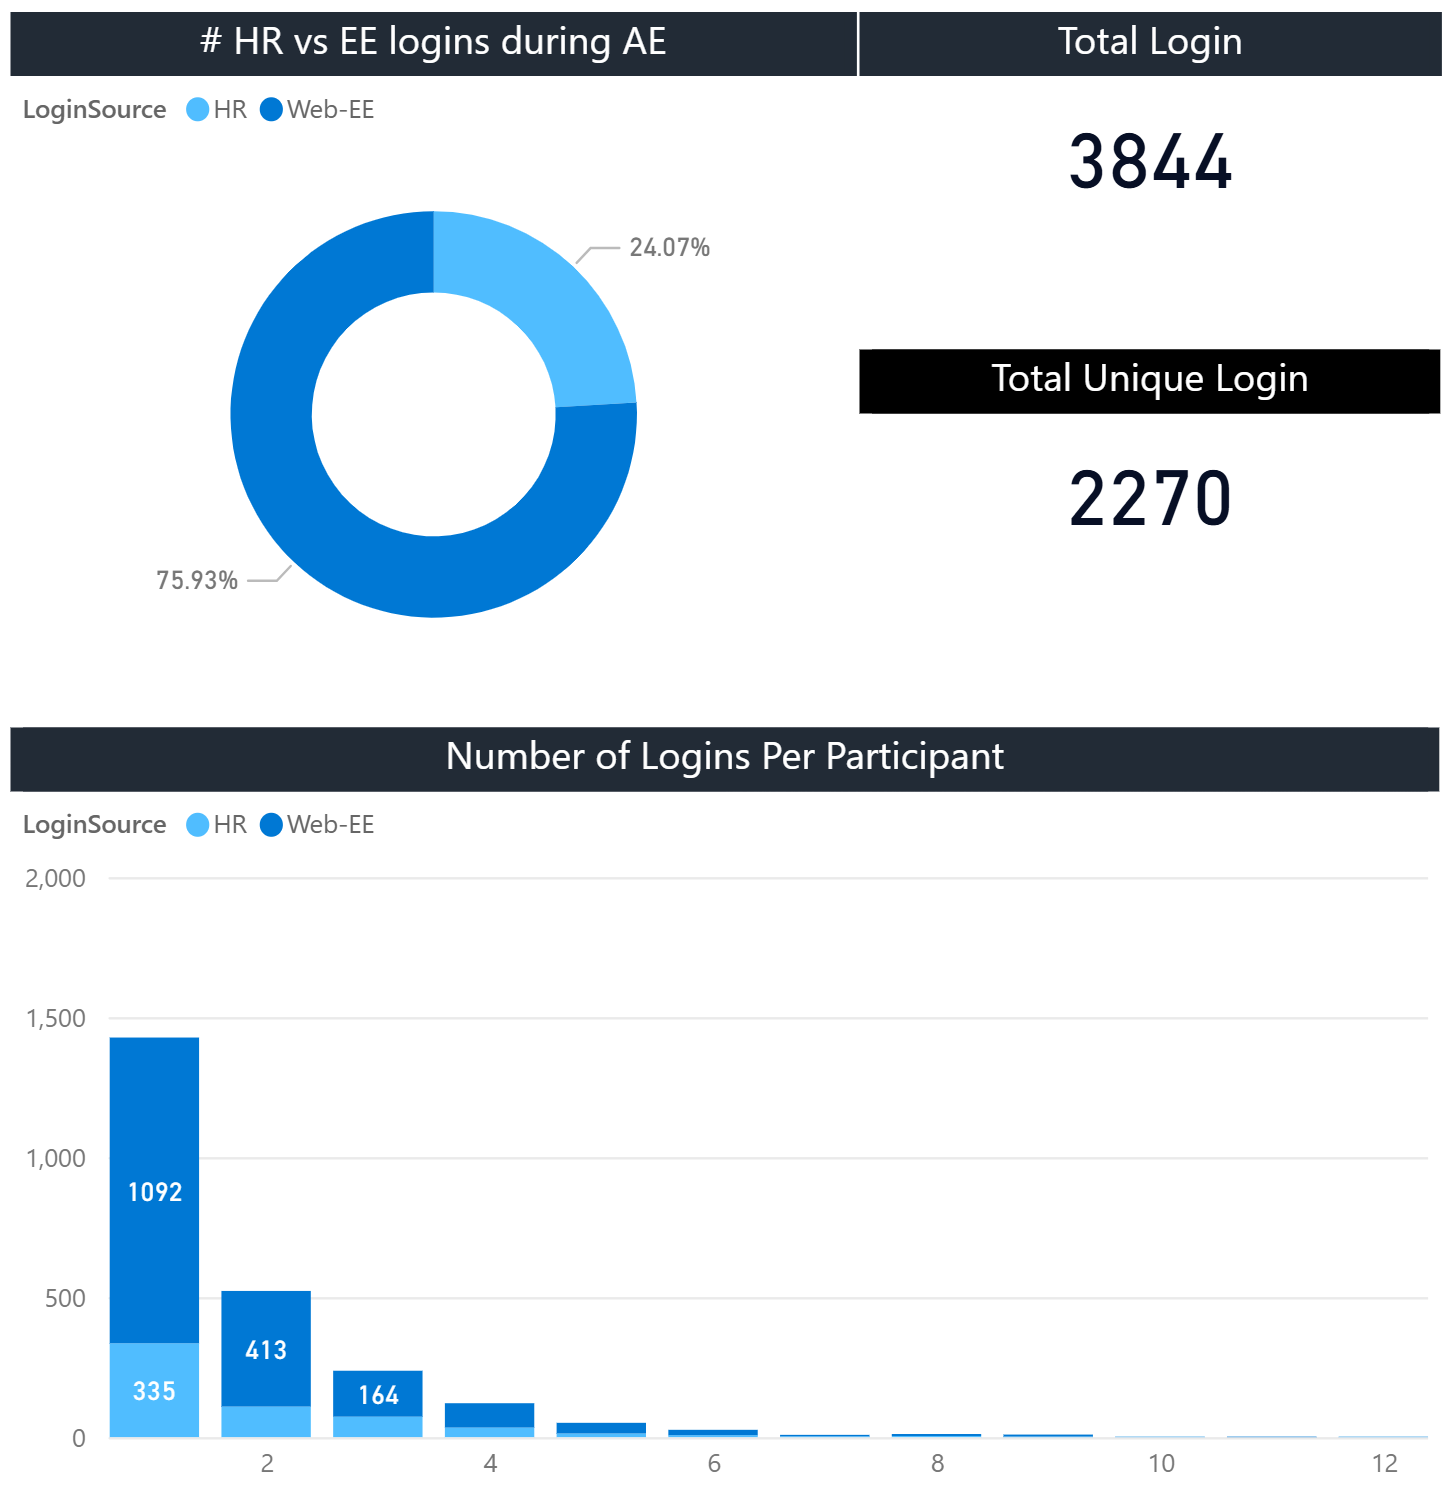
Here, log-in frequency per participant may suggest that employees are experiencing confusion or difficulty with the enrollment process. The “total log-ins” category indicates the overall usage of the enrollment platform, which can indicate the level of employee interest. The “total unique log-ins” category helps identify how many different employees are accessing the platform, which can help determine whether a large percentage of workers are engaging or whether a small percentage of workers is very active.
Email open and click-through rates
Monitoring open and click-through rates in a digital campaign is crucial for evaluating the effectiveness of communication strategies and ensuring that employees have a smooth and efficient enrollment experience.
Figure 3: Open and click-through rates
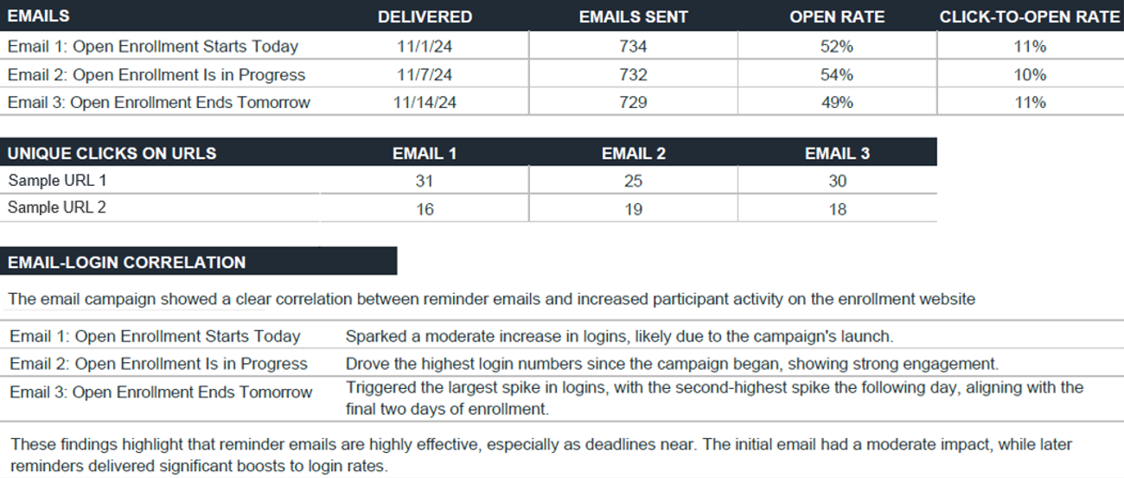
Figure 3 shows the following:
- Open rates: This metric indicates the percentage of recipients who opened campaign emails. High open rates suggest subject lines and timing are effective at capturing attention, while low open rates may indicate a need to improve email content or timing.
- Click-through rates: These show how many recipients take action after opening the email, a sign of how engaging the email content is.
- Correlation between email log-ins and participant activity: Frequent log-ins after receiving reminder emails may suggest a communication strategy is effective at prompting action. Infrequent log-ins can help identify areas where an employer needs to improve messaging, timing, or engagement strategies.
Figure 4: Impact of email campaigns on participant activity
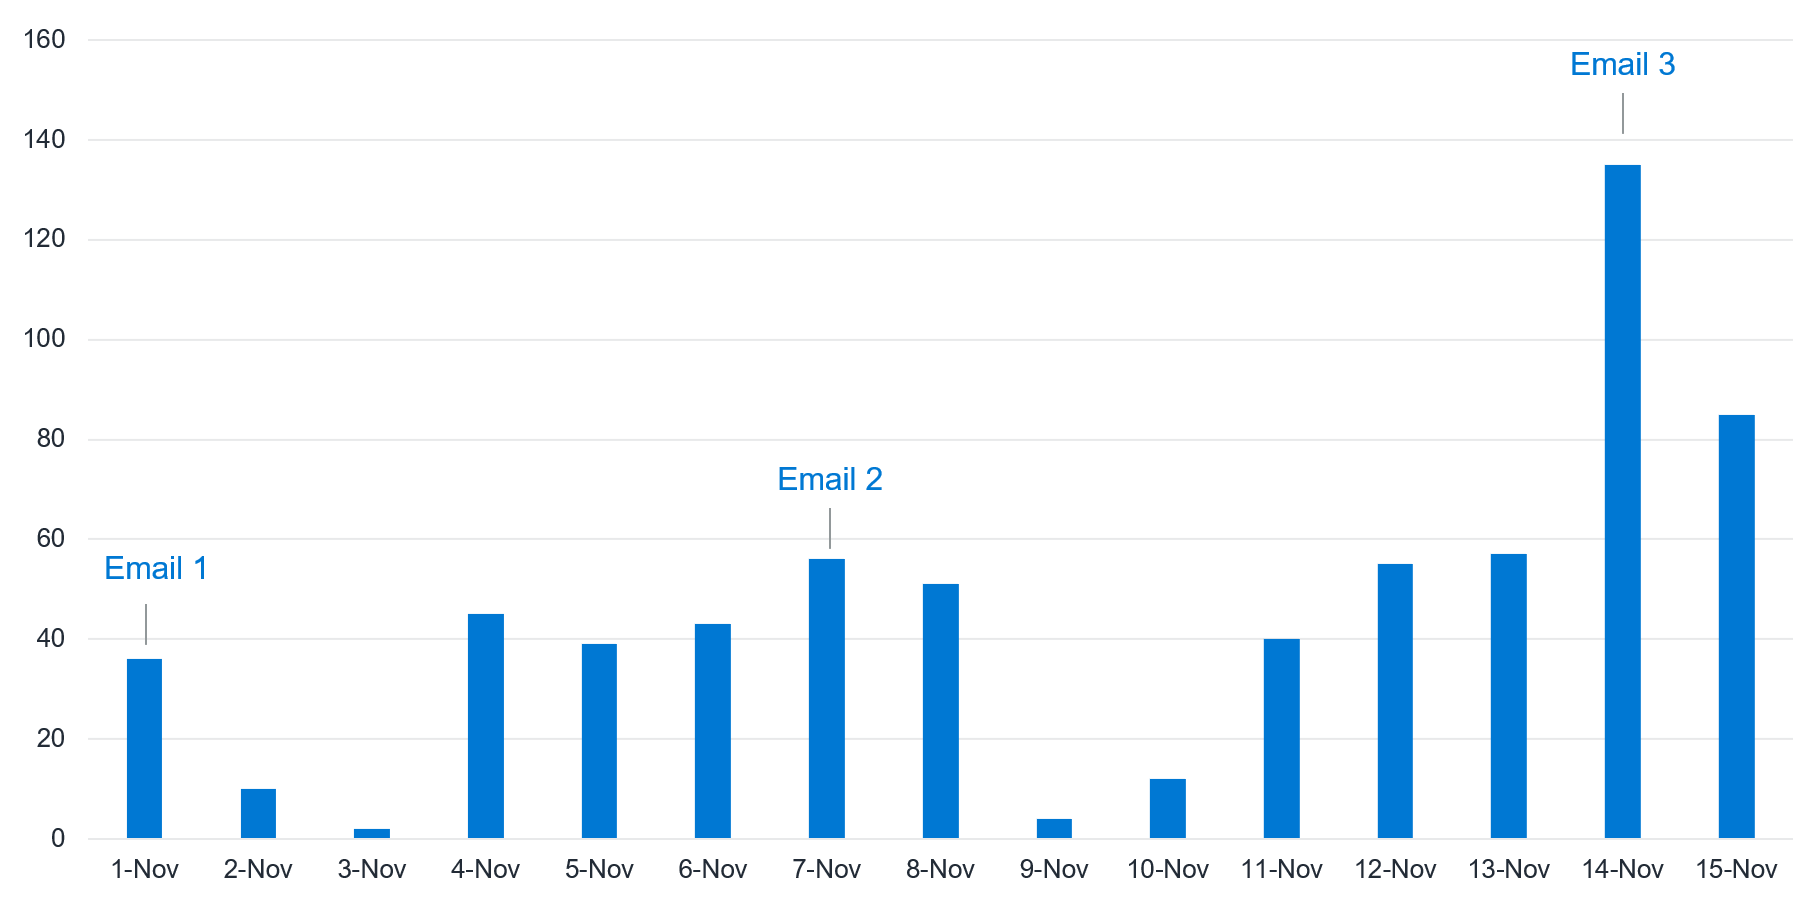
Figure 4 shows the following:
- Unique clicks on URLs: The bar chart in Figure 4 gives an example of the impact of email campaigns on participant activity. A peak in log-ins after sending a reminder email indicates the communication strategy is effective.
Enrollment migration reports by benefit
Enrollment migration reports by benefit also serve as a powerful monitoring tool. They include tracking shifts in benefit selections through additions, declines, and changes, as well as identifying movement patterns to see which benefits are gaining or losing popularity. Shifts between benefit options indicate how employees view benefit plans.
The left-hand side of Figure 5 shows four participant count metrics:
- Newly enrolled benefits
- Changed benefit
- Declined coverage
- Ended benefit
Figure 5: Changes in health benefit election and dependent count
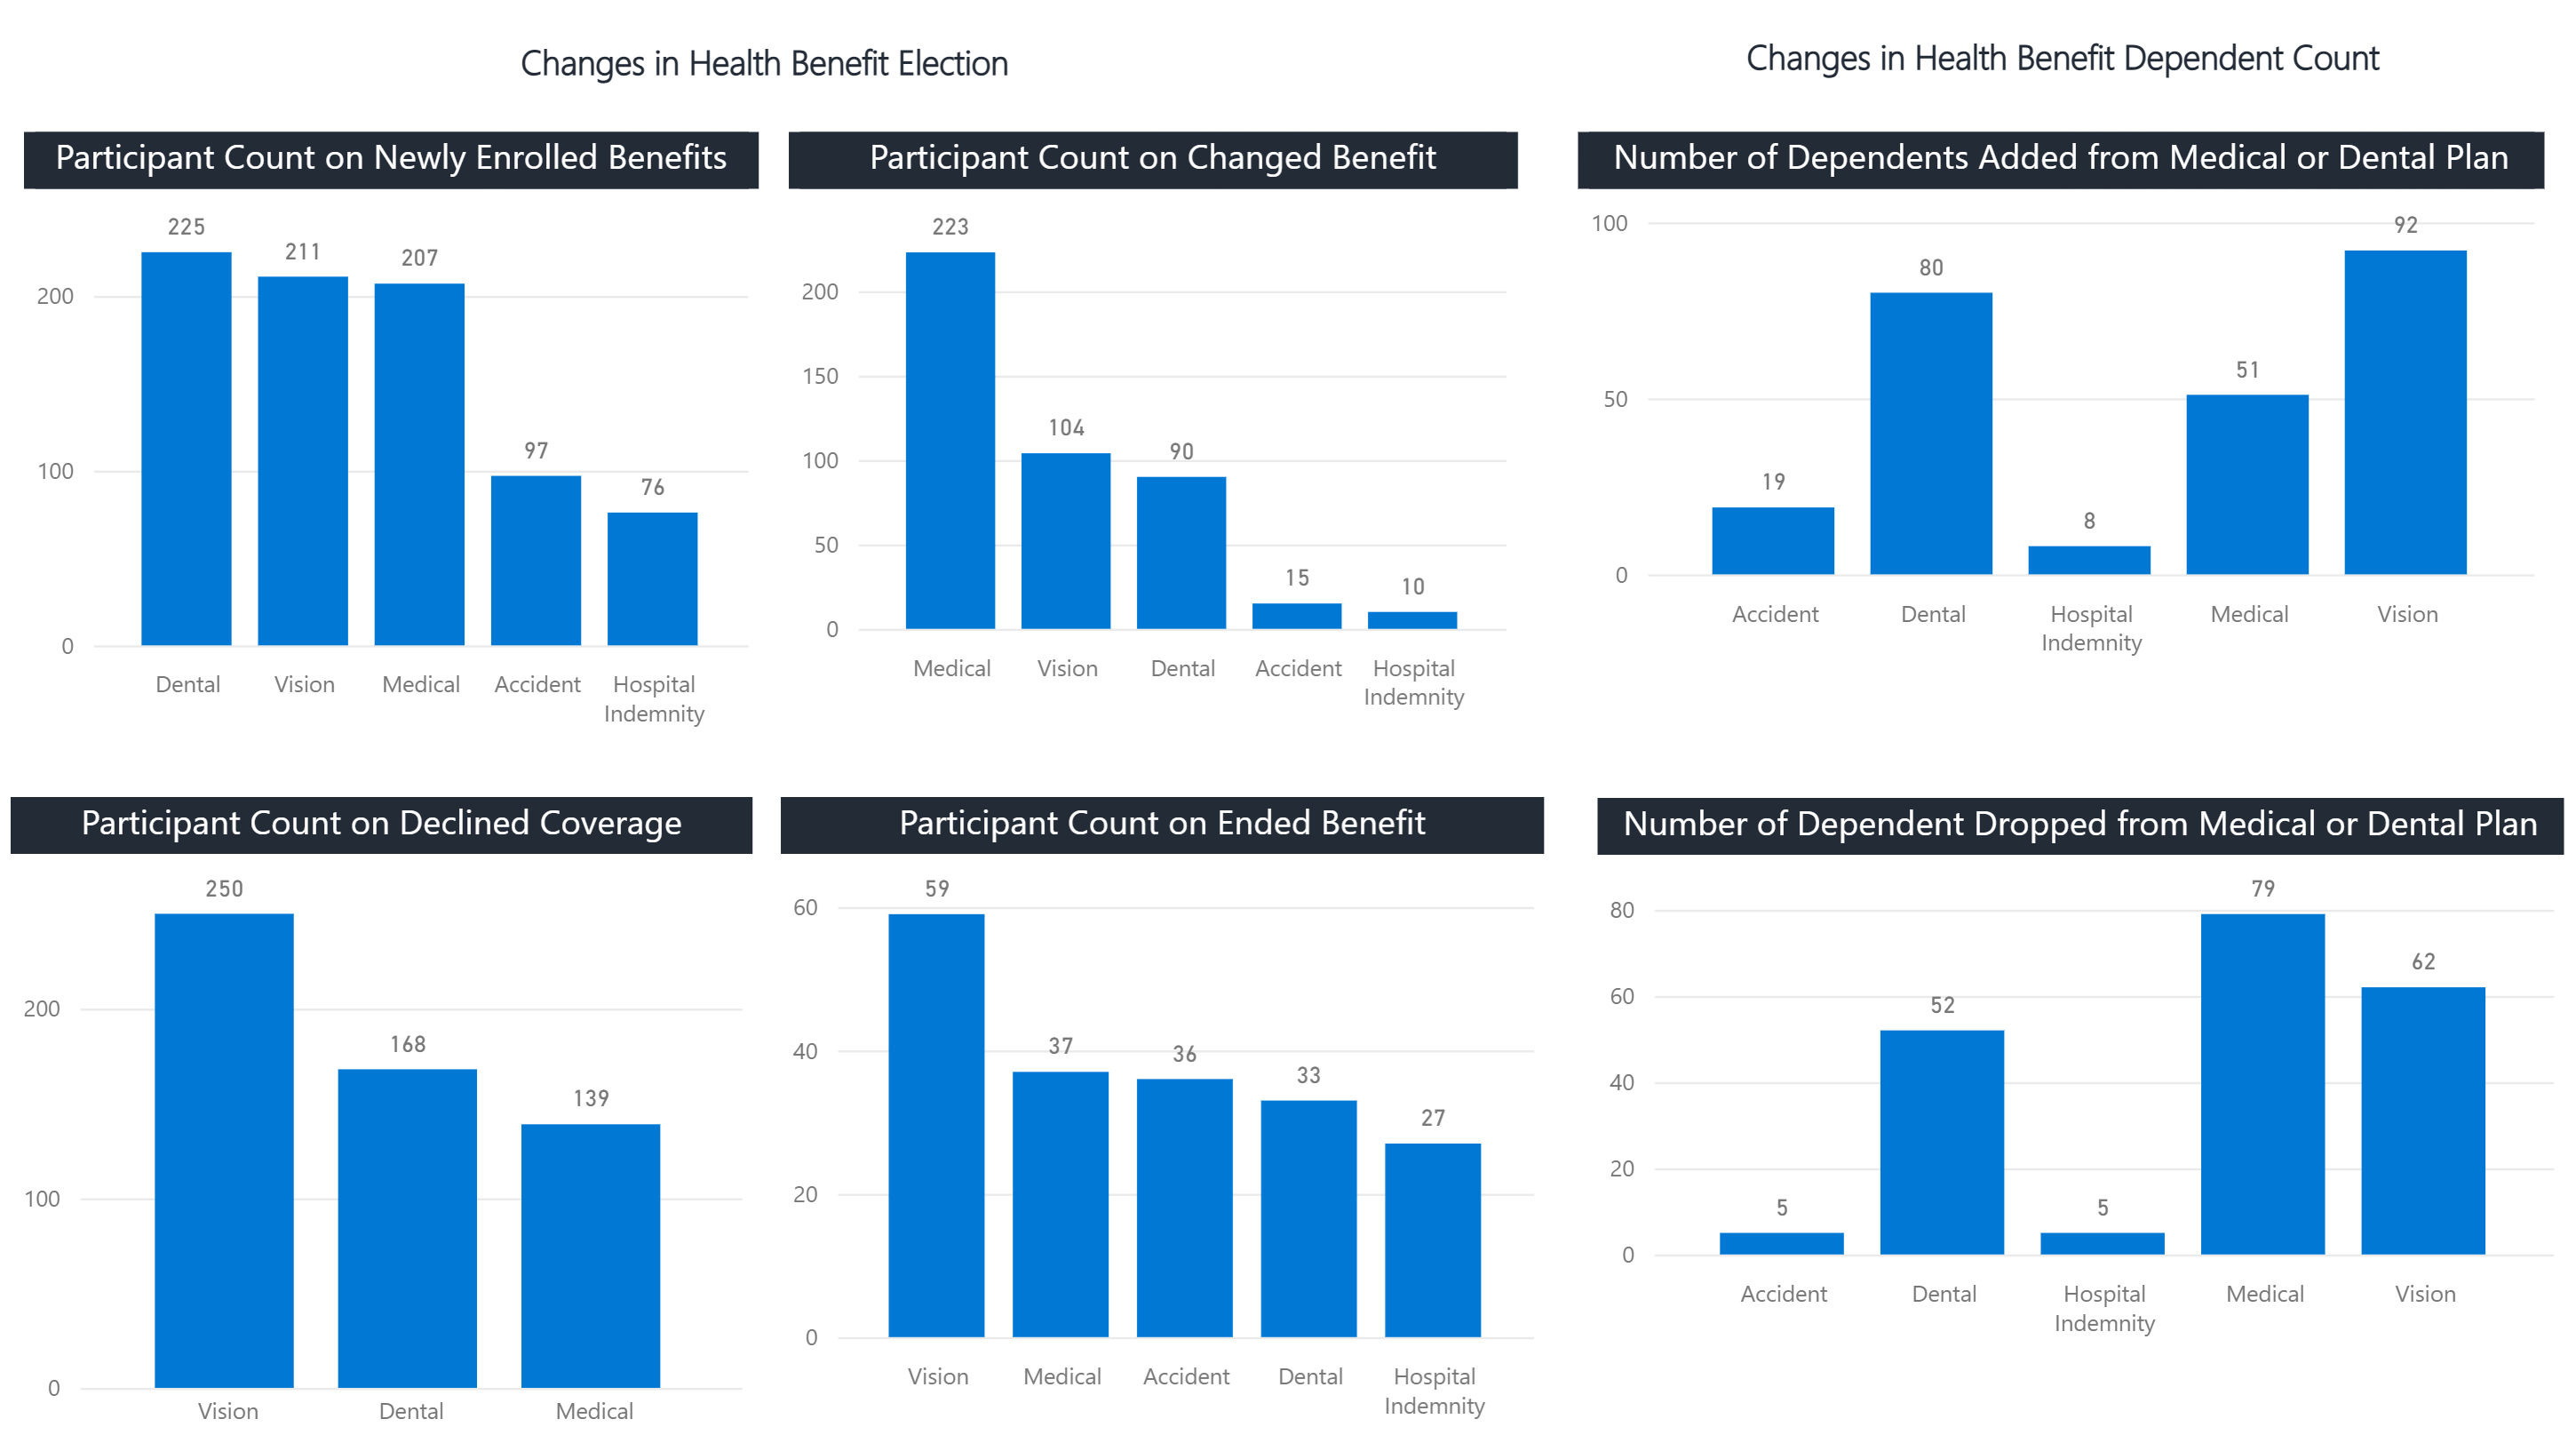
High enrollment in certain benefits suggests successful messaging, while low uptake indicates a need to improve awareness and explain the benefits more clearly. It may also indicate a lack of interest in a particular benefit and suggest employer subsidy dollars could be better spent elsewhere.
The right-hand side of Figure 5 shows how many dependents were added or dropped from a medical or dental plan. Shifts in the number of enrolled dependents (for example, changes in how many spouses, children, or other qualified relatives are covered) can signal several things about a plan’s offerings or the effectiveness of its communication with employees. When employees enroll or disenroll dependents in large numbers, it can suggest that the plan’s premiums or coverage tiers no longer align with perceived value. If costs rise and are not well-communicated, employees might reconsider the value of adding dependents. Conversely, enhanced coverage or well-priced dependent rates can boost enrollment. Shifts could also reflect changes in plan design—such as deductible structures, copays, or coverage limits—that make the plan more (or less) appealing to dependents. Large-scale changes in employee demographics or life events—marriages, childbirth, or a shift to an older workforce—can alter how many dependents need coverage.
Understanding these demographic shifts helps employers tailor communication and plan design offerings to match current workforce needs.
Additional insights can be gleaned by digging deeper into migration from one option to another within a single benefit. Unexpected switching—when an employee jumps between similar plans or makes unexpected choices—generally signals confusion and the need for clearer information and education about plan options. It also might relate to some other influences, such as pricing or compensation pressures.
Ultimately, employers can use migration trends to inform strategy. Analyzing these patterns can help tailor future benefits offerings and communication campaigns to better align with employee needs and preferences.
Customer service metrics
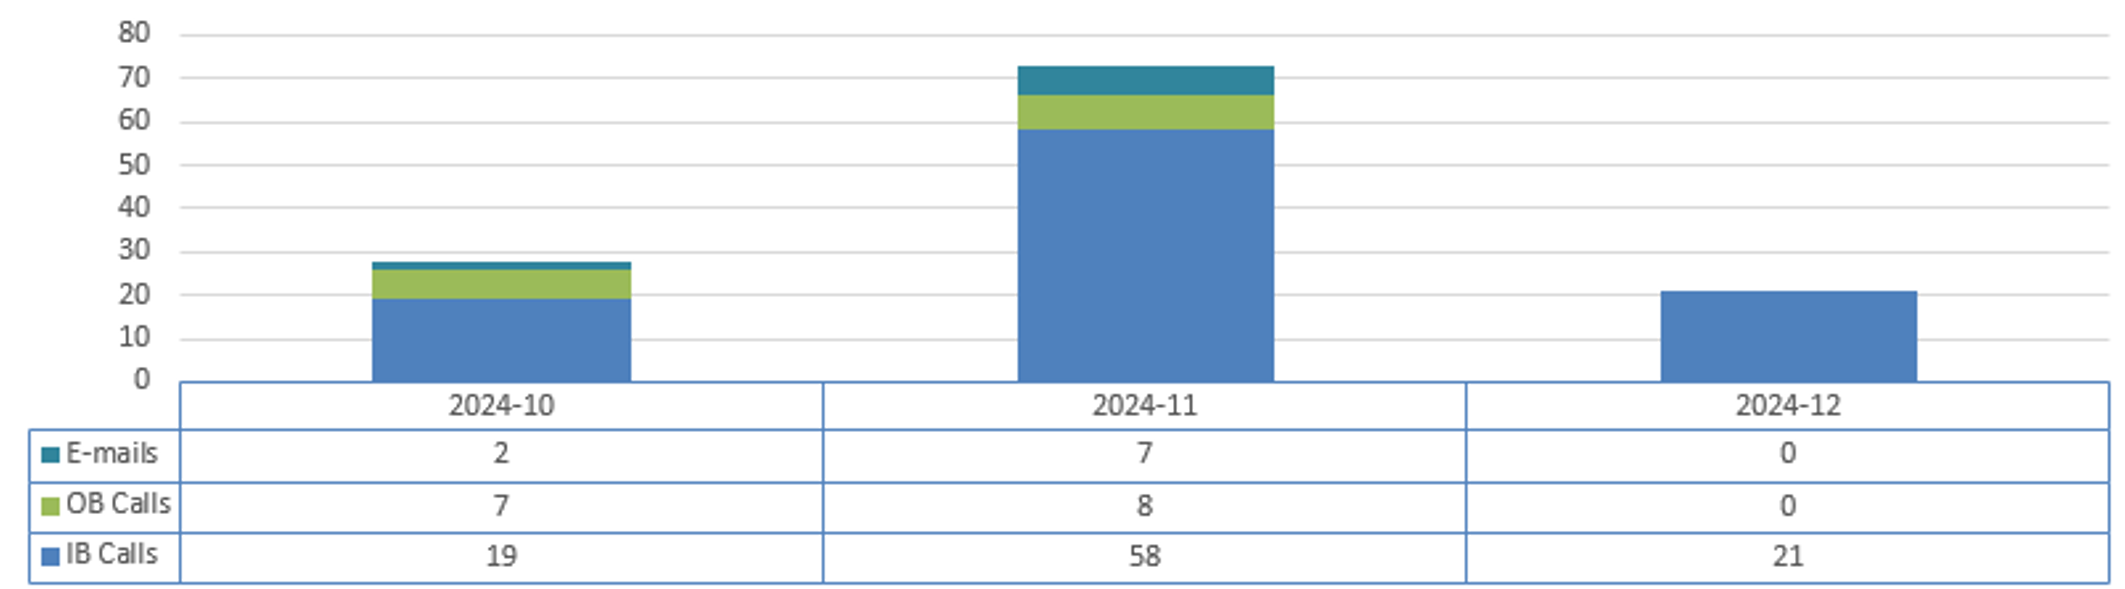
Customer service metrics also can provide valuable insights. The bar chart in Figure 6 shows participant contacts made over the fourth quarter of 2024. The bars distinguish between emails, outbound calls, and inbound calls and show a notable increase in November. This metric helps employers understand the volume of inquiries and the demand for customer support during open enrollment. Customer service metrics can also track the length of each interaction, helping employers understand employees’ preferred mode of communication, the efficiency of the customer service team, and the potential need to add resources during periods of high demand.
Figure 6: Participant contacts
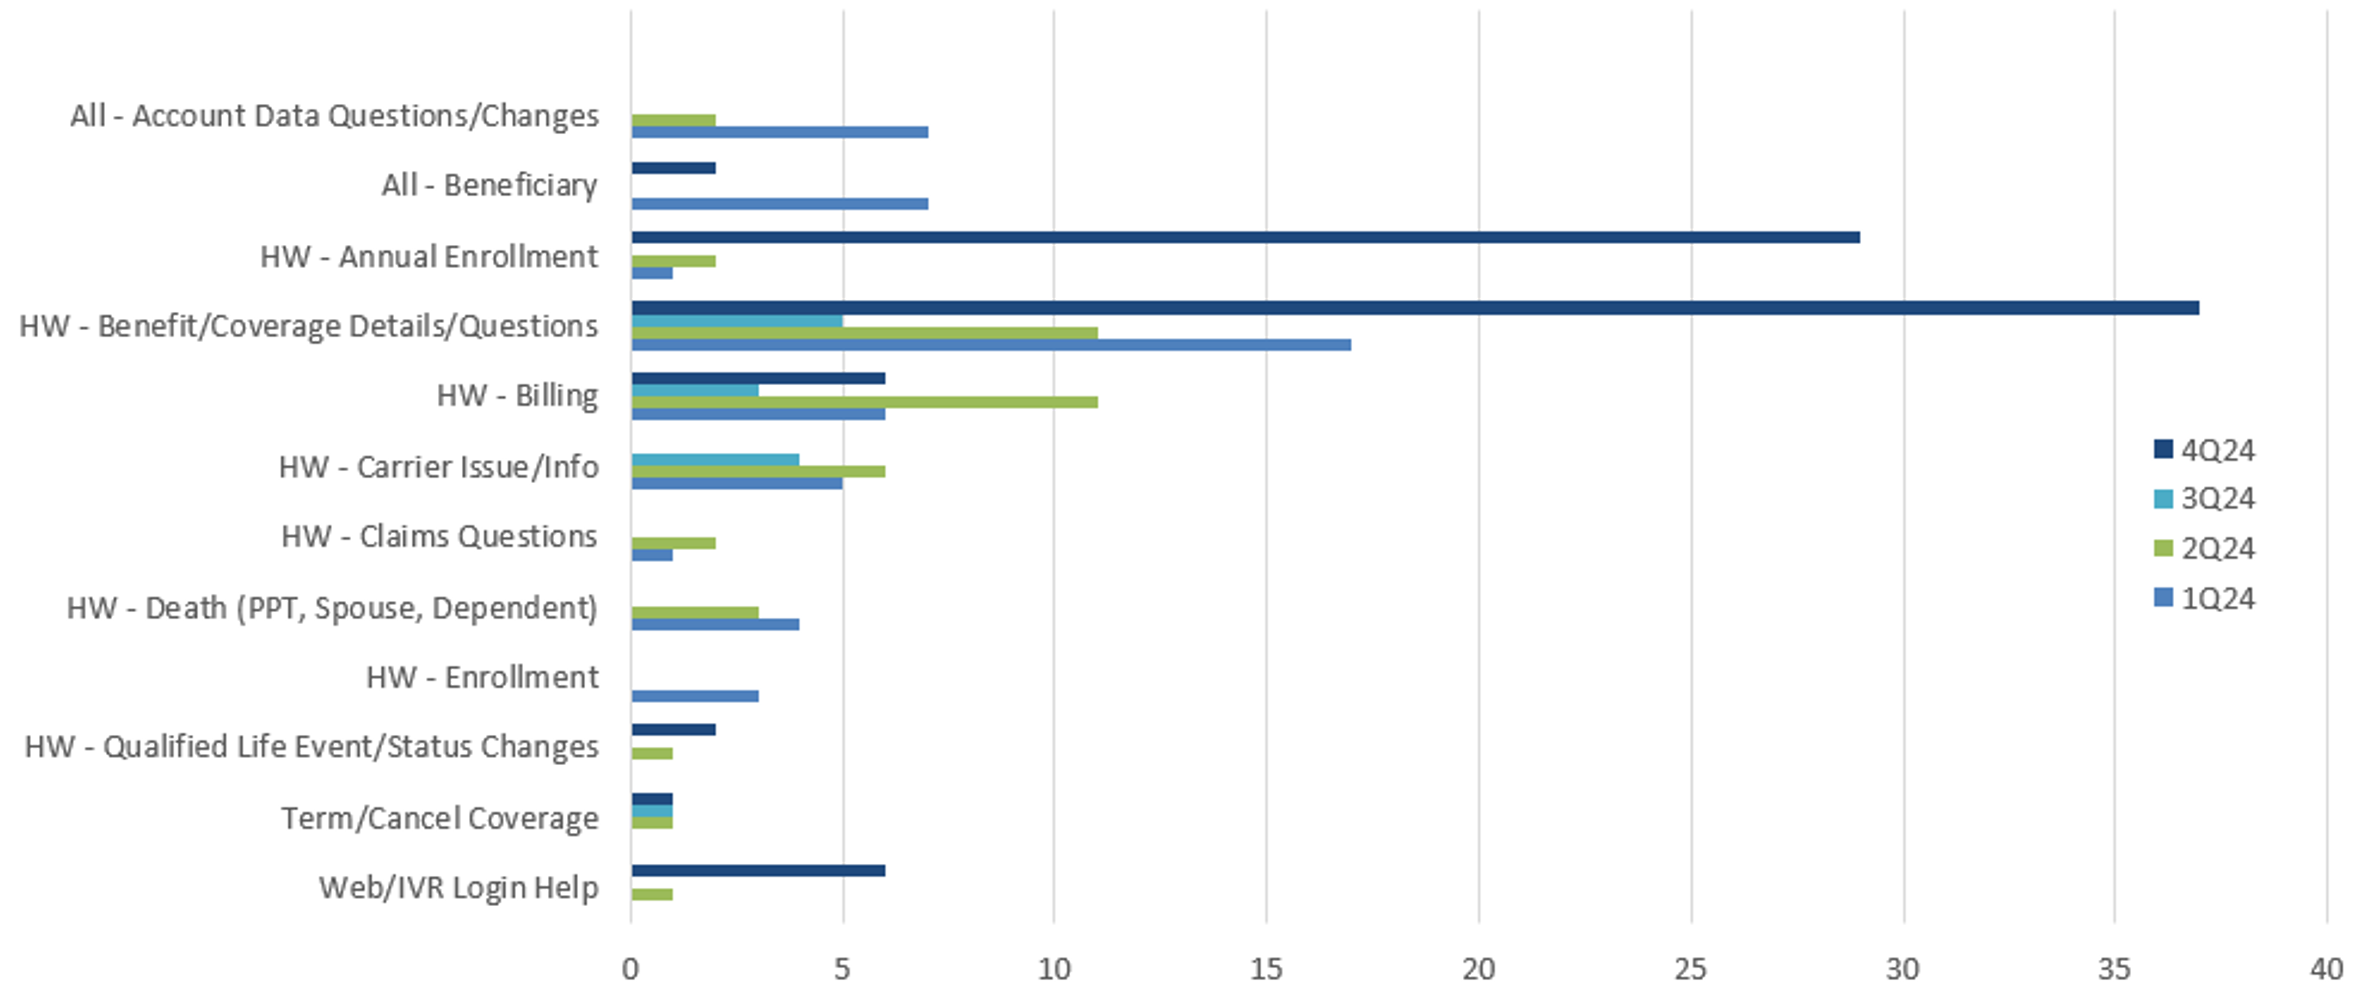
Digging deeper, “top reasons for participant inbound calls,” shown in Figure 7, is another important customer service metric, helping highlight areas where communication could be improved and where employees may need clearer information about benefits and coverage. The chart shows some reasons for phone calls, offering insight as to when to anticipate spikes for various reasons.
Figure 7: Top reasons for participant inbound calls
Discovering hidden issues in employee benefits through metrics
All told, open enrollment participant engagement metrics are vital indicators of how effectively communication strategies have resonated with the target audience. The metrics provide data on participant behaviors, preferences, and responsiveness during the enrollment period.
By analyzing these data points, employers can gauge the success of communication campaigns, identify areas for improvement, and refine future strategies to enhance engagement and enrollment outcomes. They can answer key questions such as:
- Are benefits messages reaching target audiences? By analyzing demographic data and segmentation effectiveness, employers can determine whether all key participant groups are engaging at similar rates.
- Is messaging resonating with participants? Employers should evaluate content performance. Which messages received the most engagement, and what themes or topics were they centered around?
- Are participant elections matching the expected strategy? Where did employees make changes in their elections? Did that match a strategy like pricing, participant messaging, decision support tools, or other factors?
- Which channels are most effective, and how can employers optimize others? Determining the return on investment of each channel can help employers decide whether resources should be reallocated to higher-performing platforms.
- How does current engagement compare to previous periods? Year-over-year metrics can identify growth trends or declines and help employers measure long-term strategy effectiveness.
Transforming benefits enrollment data into actionable HR insights
Transforming enrollment data into actionable insights involves analyzing data to inform strategy, adjusting benefits administration, and setting measurable goals. Data without action is a missed opportunity. Employers should leverage enrollment data to guide decisions and drive improvements, using tools and strategies such as:
- Segmentation analysis: Break down data by department, location, or demographic to identify specific needs.
- Trend analysis: Compare current data with previous periods to identify patterns.
- Process improvements: Streamline enrollment procedures based on feedback and observed bottlenecks.
- Technology enhancements: Invest in platforms that offer better user experiences and data analytics.
- Key performance indicators: Establish metrics to track progress toward strategic objectives.
- Continuous monitoring: Regularly review metrics to assess the effectiveness of implemented strategies.
As employers prepare for this fall’s open enrollment season, here are three main themes to remember:
- Make data-driven decisions: It’s never too early in the year to begin analyzing enrollment data. Employers should collect and use enrollment metrics to uncover hidden issues and opportunities, and to identify areas for improvement, engage with employees, and set next year’s benefits plan.
- Engage employees: To enhance employee communication and participation—and to stay attuned to employees' evolving needs—employers should regularly conduct benefits surveys. This continuous feedback loop ensures that company benefits remain relevant and valuable to the entire workforce.
- Focus on the future: Anticipating future trends should be a crucial part of strategic benefits planning. For instance, demographic shifts require adapting benefit offerings to a changing workforce. Similarly, embracing technological advancements can significantly enhance how companies deliver benefits and engage with employees. This helps streamline benefits administration and provides a more interactive and personalized experience for employees. As a benefits program evolves, employers should look for ways to gather new metrics to use in their analysis.
To shape the benefits strategy for the next campaign, it's essential to apply the insights gained from all of the metrics to the planning processes. This additionally involves thoroughly assessing employee needs and staying informed about market trends. By doing so, employers can anticipate demographic shifts and technological advancements and leverage key metrics to drive their strategy forward.