This article was originally published in October 2014. It was updated in January 2017 to reflect nomenclature change. Thanks go to Jessica Gardner, Scott Preppernau, and Frank Thoen for these updates.
A variable annuity plan (VAP) is a defined benefit (DB) pension plan where the benefits adjust each year based on the return of the plan’s assets, resulting in stable funding requirements. Although VAPs have been allowed under Internal Revenue Service (IRS) rules since 1953 (see Revenue Ruling 185, 1953-2), they are not common.
Benefits are typically earned on a career average or flat dollar type of accumulation. A central feature of a VAP is the “hurdle rate,” which is basically a conservative investment assumption upon which the plan’s benefit level is based. The hurdle rate is usually set between 3% and 5%, though it could be higher than 5%. If the plan’s assets were to return the hurdle rate each year, benefits would never change, exactly like a traditional DB plan. However, when the plan’s assets return more (or less) than the hurdle rate, benefits increase (or decrease) by the difference between the actual return and the hurdle rate. These benefit adjustments keep the plan’s assets and liabilities in balance by adjusting benefits each year to the level that can be afforded based on the plan’s actual investment experience.
In the VAP design, these benefit increases and decreases apply equally to all participants’ benefits, whether active, retired, or terminated vested. This means that retirees will experience decreases in their benefits in some years, just as they can in a DC plan. However, benefit decreases can be eliminated in all but the most severe market downturns by adopting a Milliman Sustainable Income Plan™ (SIP). SIPs build on and improve the VAP design by providing benefit stability.
VAPs are not generally final average earnings plans for two primary reasons. First, the contribution each year needs to fund the benefits accruing for that year. If the benefit earned in a year is tied to future pay, which is as yet unknown, as it is in a final average pay plan, the benefits can become underfunded. Second, the purpose of providing a final average pay formula is to tie all years of service to the final wages. In this way the entire benefit keeps pace with inflation. The VAP design does this successfully with a career average or flat dollar benefit accumulation because the expected long-term asset return on a balanced portfolio is larger than the hurdle rate, providing expected benefit increases, both over a participant’s working and retirement years.
Active VAPP benefit example
Suppose a company with a VAP that has a hurdle rate of 4% and a 2% career average benefit hires a new participant in 2015 who earns $60,000 in 2015 and gets pay raises of $3,000 per year thereafter.
The 2015 accrual for this participant is $2% x $60,000 / 12 = $100.00 per month. The 2016 accrual for this participant is $2% x $63,000 / 12 = $105.00 per month. This is the same as any other career average plan. Accruals for 2015 through 2019 are shown in the table in Figure 1. The table also shows what happens to these accruals in the years after they are earned.
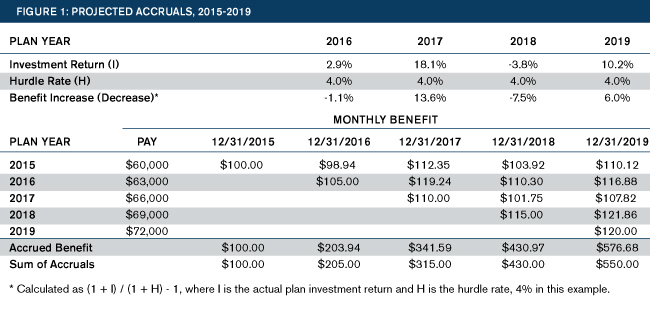
The table in Figure 1 shows the change in the 2015 accrual of $100.00 over the period 2016 to 2019. In 2016, the plan assets returned 2.9% which, while positive, is less than the hurdle rate of 4%. This results in a decrease in accrued benefit of 1.1% (102.9% / 104% - 100%) to $98.94. The VAP defines annual benefit changes as (100% + actual return) / (100% + hurdle rate) - 100%. At the end of 2016, the participant’s 2015 accrual is worth $98.94 and the participant has earned a new benefit of $105.00 for a total benefit of $203.94 ($98.94 + $105.00).
In 2017, the asset return was 18.1%. The accrual from 2015, previously worth $98.94, changes to $112.35. The 2016 accrual changes from $105.00 to $119.24 and a new accrual of $110.00 is earned for a total of $341.59. A year-by-year comparison of the sum of the original accruals to the current value of the total accrued VAP benefit appears at the bottom of Figure 1. As of December 31, 2018, after a poor return year, the VAP benefit is about the same as the sum of the original accruals. However, by December 31, 2019, the VAP benefit of $576.68 is more than the sum of the accruals, $550.00.
The benefit from year to year can be volatile. However, the adjustments keep the assets and liabilities in balance, resulting in stable funding requirements even in down markets. The contribution requirement each year is the value of benefits accruing for the year, much like a defined contribution plan, without any surprises. There is no contribution requirement volatility because the annual benefit adjustments result in liabilities that match the plan’s asset value.
For more information on how VAPs (and SIPs) are funded see SIPs: Predictable Contributions and Accounting.
Though volatile, the benefits in a VAP are expected to increase over time, as the long-term expected return on a balanced portfolio is expected to be greater than the hurdle rate. This is expected to provide some inflation protection to the benefit, both while active and in retirement.
At retirement, the benefit can be elected in a form that covers the participant’s lifetime only, such as a single life annuity, or the participant’s and spouse’s lifetime, such as a joint and survivor annuity, just like in a traditional defined benefit plan.
Retiree VAP benefit example
The graphs in Figures 2 to 4 illustrate how a retiree’s VAP benefit would have changed over different historical periods, 1926 to 1955 (Figure 2), 1955 to 1984 (Figure 3) and 1984 to 2013 (Figure 4). Each period shows a retiree with a starting retirement benefit of $1,000 for a plan with a 4% hurdle rate invested 70% in large company stocks (S&P 500) and 30% in long-term high-grade corporate bonds. The blue line shows a VAP benefit, where benefits move up and down with the plan’s actual investment returns. The green line shows a $1,000 monthly benefit adjusted for inflation, which is the benefit level that would maintain the retiree’s purchasing power over the period.
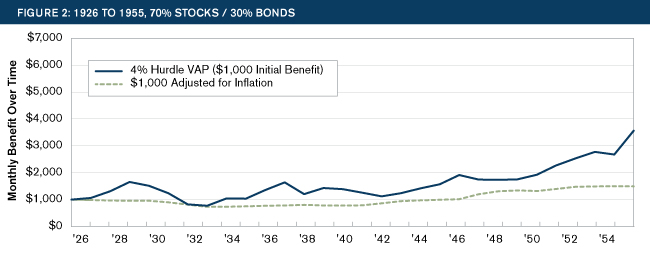
Over the 29-year period from 1926 to 1955, the VAP benefit (blue line) increases more than inflation (green line), providing good inflation protection to retirees. At the end of the 29 years, the $1,000 adjusted for inflation has grown to $1,500. While the benefit increases over time and outpaces inflation, the retiree is on a very bumpy benefit ride. The initial retirement benefit increases from $1,000 to over $1,500 by 1929. Then the stock market crash (which occurred over four years) causes the benefit to decline below the original $1,000. It is eight years before the benefit again surpasses the high-water mark achieved in 1929.
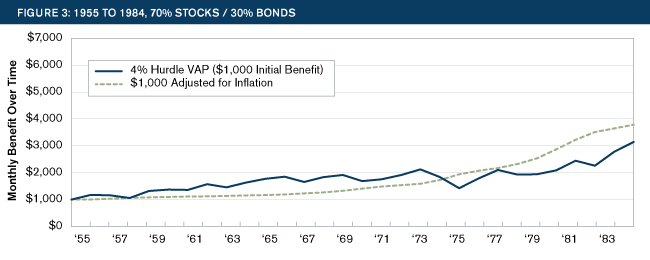
Over the 29-year period from 1955 to 1984, the VAP benefit (blue line) increases more than inflation (green line) initially, but cannot keep pace with the very high inflation of the 1970s. However, the benefit does better than a traditional DB benefit that generally remains fixed in retirement. Again, the benefit is volatile with several years with benefit decreases.
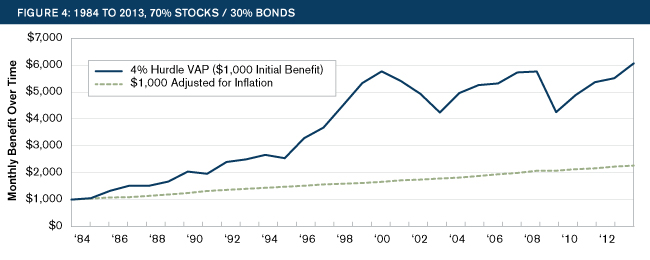
Over the 29-year period from 1984 to 2013, the VAP benefit (blue line) increases substantially more than inflation (green line). This period saw very good investment returns coupled with relatively low inflation. There are two very dramatic benefit declines, however, one after the dot-com bubble in the early 2000s and one after the housing crisis in 2008. A retiree’s benefit would have gone from about $5,500 in 2008 to about $4,400 in 2009, the second time a 20% benefit drop occurred in one decade.
Although VAP benefits are expected to increase over time, providing at least some inflation protection, the benefit volatility can be difficult for retirees to bear. However, the plan remains well-funded in all market conditions, providing the participant with the security of a lifelong stream of income (although the level of income is not fixed) from a well-funded plan, and providing the employer with very stable contribution and accounting requirements. In addition, benefit decreases can be eliminated in all but the most severe market downturns by adopting a SIP design.
VAP strengths
- VAPs stay fully funded. Because the benefits adjust to changes in the market, the liabilities move with the assets and the plan stays well-funded at all times.
- VAPs provide funding and accounting consistency. There is no funding volatility that is due to asset or yield curve changes. Because the liabilities adjust to the value of assets, the plan stays well-funded and there are no variable rate Pension Benefit Guaranty Corporation (PBGC) premiums. This also results in consistent accounting and financial statements from year to year.
- VAPs have predicable employer costs. Because there is no funding volatility that is due to asset performance or changes in the yield curve, the contributions to a VAP are stable from year to year, typically a flat dollar amount or a percent of payroll.
- VAPs are expected to provide inflation protection. VAP benefits are expected to increase over time, as the expected return on the asset portfolio is greater than the hurdle rate. While the increase does not move in lockstep with inflation, it is expected to provide purchasing power protection over time.
- VAP benefits are portable. The benefits in a traditional defined benefit plan stop growing when an employee leaves. This is a concern for industries with mobile workers. Because VAP benefits are expected to increase over time, workers who change employers are not left with inadequate frozen retirement income.
- VAPs provide lifelong income. A VAP provides participants with lifelong income, like a traditional defined benefit plan. This eliminates the possibility of outliving one's assets, as in a defined contribution plan.
- VAPs provide longevity pooling. Longevity pooling allows a plan to fund to a group’s average life expectancy, instead of a maximum life expectancy. This allows the plan to provide larger participant benefits per dollar contributed.
- VAPs provide professional investment management. As a DB plan, a VAP will have professional asset management, resulting, on average, in approximately a 1% per year higher return compared to participant-directed DC plans.1 This maximizes the retirement benefit value of each dollar contributed to the plan.
VAP weaknesses
- Benefits are volatile. In a VAP participants’ benefits go up with good investment returns and down with poor returns, both while they are working and when they are retired. While this results in long-term expected benefit growth and maintains a well-funded plan at all times, it can produce short-term pain for retired participants. See SIPs Stabilize Benefits for the SIP plan design features that effectively eliminate this concern.
- Communication challenges. Because this plan design is quite different from a traditional defined benefit plan, there will need to be substantial up-front communication to participants at the time the plan is established, as well as a significant amount of communication and education as part of the retirement process, to make sure participants understand the characteristics of the VAP.
- VAPs do not provide contribution holidays. Basic VAP liabilities and assets are in balance. Up markets do not create overfunding that can be used to provide the sponsor with a contribution holiday. Instead, they provide benefit increases. This means that the sponsor needs to plan to make a stable contribution each year, as with a DC plan.
- VAPs are not common. When plan sponsors consider changing their plan designs, they typically ask what other plans are doing. There is increasing interest in VAPs, especially those with stabilization features (such as SIPs), but no solid trends to point to yet. It is important that a plan moving to a VAP design involve legal counsel.
Conclusion
VAP benefit design should be seriously considered by plan sponsors that fear their DC participants will fall short of sufficient retirement savings and by DB sponsors that cannot bear the contribution volatility that has been endemic in the last decade. VAP benefits provide lifelong income to participants, with stable contribution requirements for the employer. The plan maximizes the value of each dollar contributed to the plan, by providing professional asset management and longevity pooling.
Benefit volatility is the VAP's biggest drawback and it can be substantially mitigated by employing SIP features. See SIPs Stabilize Benefits for details.
1 Towers Watson Insider (December 2009).