This article summarizes the key financial results of medical professional liability (MPL) specialty writers from the second quarter of 2026, continuing our 17th-consecutive year of tracking and publishing these results in Medical Liability Monitor. As in prior years, we compare second-quarter results with historical Q2 and full-year figures to provide insight into where 2026 results may be headed.
Our analysis reflects the collective financial performance of a large composite of insurers specializing in MPL coverage. It draws upon 20 years of aggregate statutory financial data compiled by S&P Global Market Intelligence. The current composite includes 194 MPL specialty companies that reported more than $8.7 billion in direct premium written in 2025.
Premium growth slowing
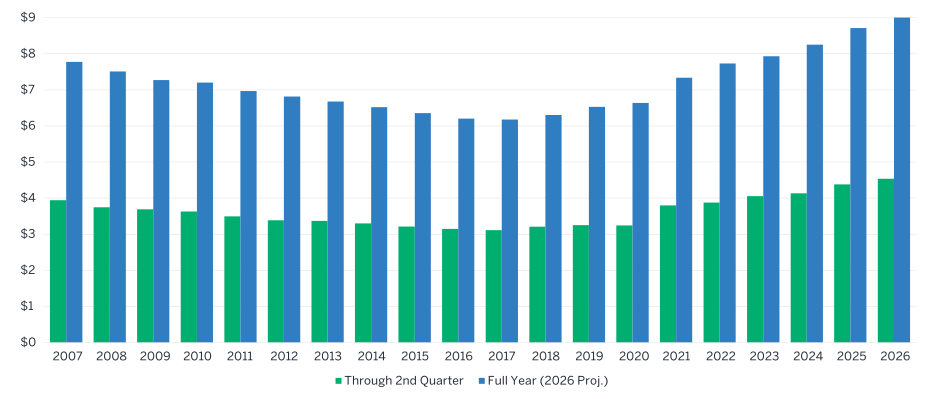
Direct written premium for our composite continued to grow during the first six months of 2026, increasing 3.6% compared with the same period in 2025. While growth remains positive, the pace has moderated from the stronger gains recorded last year.
The first-half results suggest that direct written premium will continue to increase for full-year 2026. As shown in Figure 1, if the current trend continues, the composite could reach $9 billion in annual direct written premium. That would represent an increase of more than $1 billion in just three years and $2 billion in six years.
Figure 1: Direct written premium — Q2 vs full-year ($billions)
Mid-year adverse development reaches 20-year high
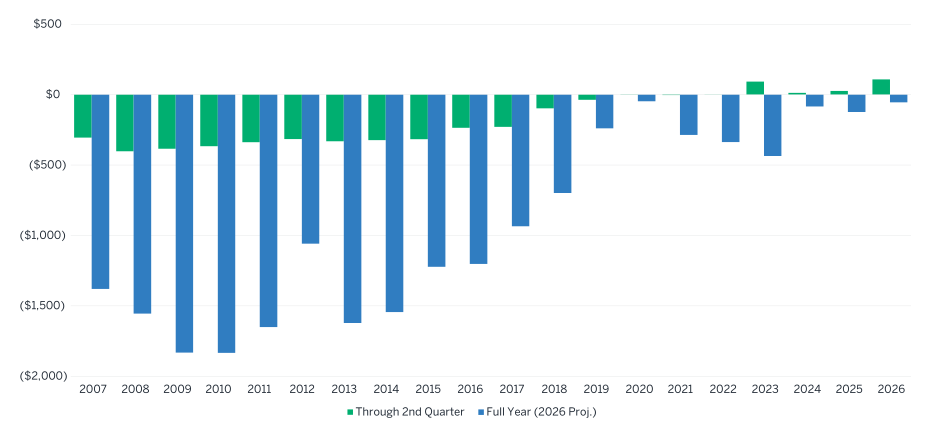
The second quarter of 2026 produced the most adverse prior-year reserve development observed in any quarterly or annual statement results over the past 20 years. As shown in Figure 2, prior-year reserves increased by $108 million during the first six months of 2026.
In recent years, the composite has generally experienced modest adverse development during quarterly reviews before ultimately reporting favorable development for the full year. We are again projecting favorable one-year reserve development for the composite by year-end. However, the expected magnitude of that favorable development has moderated since our first-quarter review.
The higher level of adverse development is partly attributable to an increase in the share of companies reporting reserve strengthening, which rose to 39% in 2026 from 37% at the same point in 2025. At the same time, a larger share of companies reported flat development, reducing the proportion reporting favorable development.
The magnitude of the reserve changes has also shifted. Among companies reporting adverse development, the average reserve increase is 32% higher than the average increase reported at the same point in 2025. Among companies reporting favorable development, the average reserve decrease is 19% smaller than it was a year earlier. Overall, more companies are beginning to strengthen reserves, and those increases are generally larger, while favorable reserve development has become less pronounced.
Figure 2: Cumulative reserve development — Q2 vs full-year ($millions)
Underwriting expenses accelerating
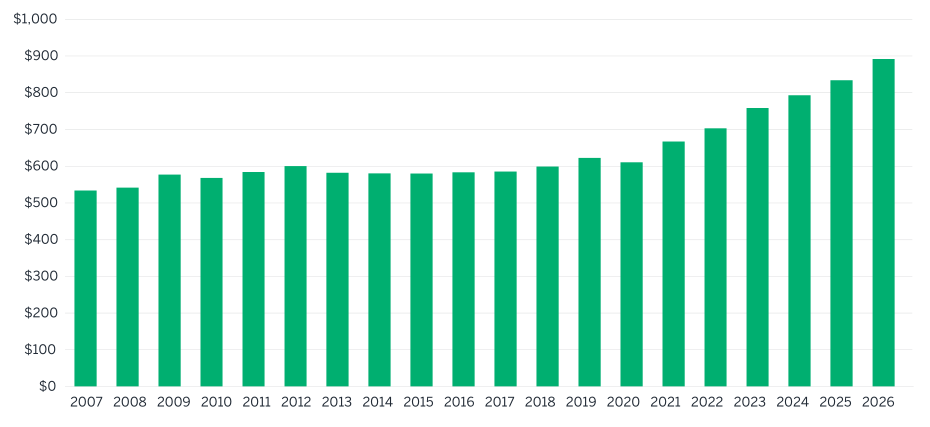
Underwriting expenses through the second quarter of 2026 reached nearly $900 million, as shown in Figure 3, representing another meaningful increase of 7% compared with the same period in 2025. While our review of the composite over the past several quarters has shown more moderate growth in underwriting expenses compared with the peaks observed in 2023, the pace of expense growth has begun to accelerate again, though it remains below 2023 levels.
A similar rate of growth in net earned premium has helped moderate the impact of rising expenses on the underwriting expense ratio. This is to be expected, as some of the increase in underwriting expenses is attributable to variable costs, such as commissions, that tend to rise along with premium volume. As a result, the underwriting expense ratio increased only slightly, from 25.4% in the second quarter of 2025 to 25.6% in the second quarter of 2026. This suggests that premium growth, whether driven by rate increases, higher volume or a combination of both, has been sufficient to largely keep pace with the growth in underwriting expenses.
Figure 3: Underwriting expenses ($millions) through Q2
Investment yields stabilizing
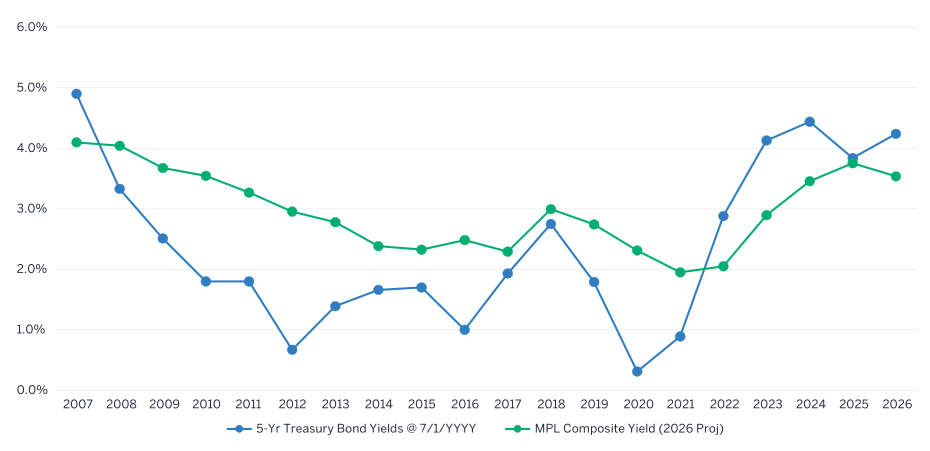
The projected net investment income yield for the composite remains elevated in 2026, although the pace of increase appears to be moderating following the stronger growth observed since 2023. As shown in Figure 4, the composite’s yield generally follows a similar, though delayed, pattern relative to the Five-Year Treasury Bond yield, which has shown signs of stabilizing over the past three years. Despite this leveling, yields remain well above the lower levels seen earlier in the decade, continuing to support strong investment income for the composite.
As discussed in the next section, investment income is a crucial component of the composite’s overall net income and should continue to be monitored closely, particularly if interest rates remain relatively stable or begin to decline in future periods.
Figure 4: MPL composite yield vs 5-year Treasury bond yield
Underwriting, investment income beginning to level
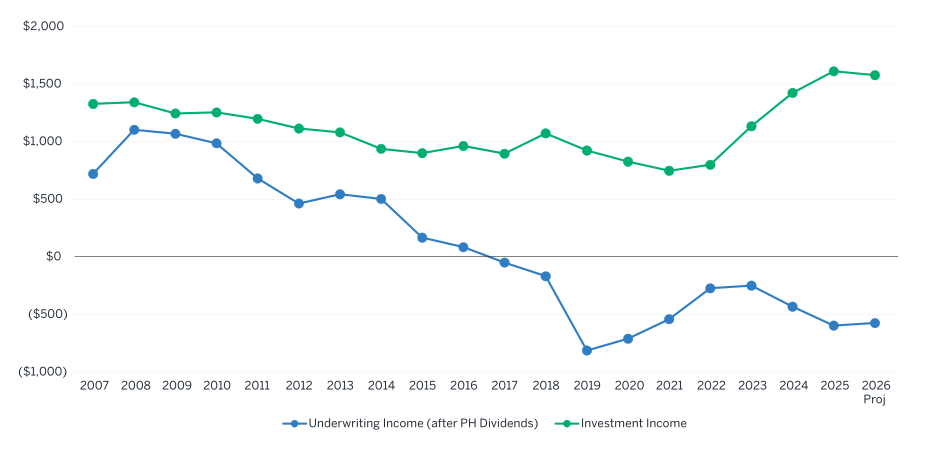
As shown in Figure 5, projected full-year 2026 underwriting income remains negative. However, the downward pressure observed since 2024 appears to be easing, with the current full-year projection indicating underwriting income that is flat to slightly improved compared with 2025. Still, given the broader deterioration in underwriting results over the past several years, investment income remains a critical component of the composite’s overall net income.
Projected full-year 2026 investment income is roughly in line with 2025, remaining near recent highs and well above the levels observed in 2024 and earlier years. While investment income is projected to stabilize in 2026 rather than continue the significant year-over-year growth seen in recent years, it continues to provide a strong offset to the composite’s ongoing underwriting loss.
Figure 5: Underwriting income vs investment income ($millions)
Conclusion
The composite remains financially strong, supported by continued premium growth that is projected to push annual direct written premium to a new high. However, the second quarter produced the most adverse one-year reserve development observed in the past 20 years, signaling increased pressure on loss trends and reserve adequacy that warrants close monitoring. While both underwriting and investment income appear to be stabilizing, strong investment returns continue to offset underwriting losses and provide significant support to the composite’s overall financial results.
The previous edition of this series can be read here.
Eric Wunder is a principal and consulting actuary, and Leah Windt is a consulting actuary, at Milliman Inc., an independent actuarial and consulting firm.
This article first appeared in the September 2026 issue of Medical Liability Monitor: http://www.medicalliabilitymonitor.com/.