On December 31, 2018, the Centers for Medicare and Medicaid Services (CMS) published a final rule that will significantly change the Medicare Shared Savings Program (MSSP). This paper is the twelfth in a series of Milliman white papers on the “Pathways to Success” proposed and final rule.
The final rule includes changes to the financial benchmark methodology that measures the gross savings or losses of an accountable care organization (ACO) under the MSSP. Four key elements of the financial benchmark methodology changed: agreement period length, regional fee-for-service (FFS) adjustment, risk adjustment, and trend. In this paper, we discuss these changes and important implications for Medicare ACOs.
Agreement period lengthened from three years to five years
CMS has lengthened the agreement period from three performance years to five performance years. Consistent with the methodology in place before this rule, (i.e., the “prior approach”), the benchmark will be rebased (i.e., recalculated using updated experience data) for each agreement period and be based upon the ACO’s experience in the historical benchmark period, which is the three years prior to the agreement period. CMS will continue to vary the weighting of benchmark years (BYs) between the first agreement period (10%/30%/60% for BY1/BY2/BY3, respectively) and later agreement periods (equal weighting).
The implications of this change for MSSP ACOs include:
- The assigned beneficiary population in later performance years may have different characteristics when compared to the assigned population in the benchmark years due to the seven-year gap between the first benchmark year and last performance year. This large gap will increase the likelihood that newly added physicians will affect performance year expenditures but not benchmark year expenditures.1 Next Generation ACOs observed this phenomenon in that program.
- The longer agreement period will magnify the effects of the 3% cap on risk adjustment increases and trend changes discussed below.
- ACOs with a stable participant list can expect to have a relatively stable benchmark due to both the longer agreement period and the risk adjustment cap discussed below.
Ultimately, ACOs have five years to work within their benchmark before the benchmark is rebased. ACOs with a favorable benchmark may be in a good position because their favorable benchmark will be applicable for a longer time period (five years). However, ACOs with an unfavorable benchmark may need to put more resources into care management improvements, participant list changes, improved coding, and other changes as rebasing will occur further down the road.
Regional FFS adjustment limited to ±5% of national assignable per capita expenditures
The regional FFS adjustment will continue to be based on each ACO’s beneficiary distribution by county and enrollment type (aged non-dual, aged dual, disabled, and end-stage renal disease [ESRD]). However, CMS will limit the regional FFS adjustment to ±5% of national assignable per capita expenditures by enrollment type. CMS has also changed the regional benchmark weights, including changing the first agreement period methodology to give weight to the regional benchmark as shown in Figure 1.
Figure 1: Regional Cost Adjustment Blending Percentages by Agreement Period, for Agreement Periods Beginning July 1, 2019, and Later
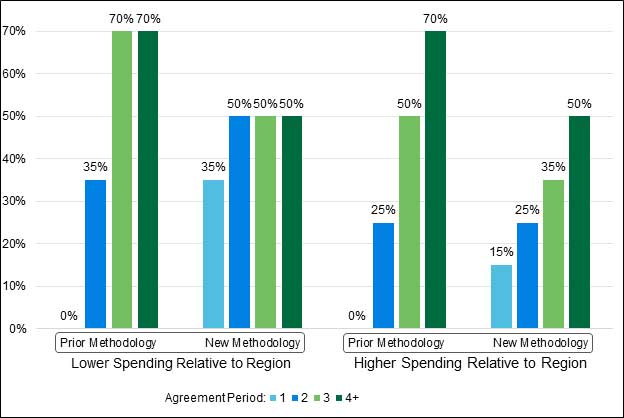
Note: Under both the prior and new methodologies, the weights apply in progression from when an ACO is first subject to the regional FFS adjustment. For example, an ACO currently participating in the MSSP and not subject to a regional FFS adjustment will be subject to the Agreement Period 1 weights in its next agreement period.
The implications of these changes for MSSP ACOs include the following:
- ACOs with benchmarks significantly below their regional benchmarks will not experience the “windfalls” they might have received under the prior regional FFS adjustment due to the regional adjustment cap. For ACOs with benchmarks significantly above their regional benchmarks, the regional FFS adjustment may not be as prohibitive of a barrier to participating in the MSSP.
- Because all agreement periods now include the regional benchmark adjustment, ACOs can have consistent perspective across all agreement periods about which tax identification numbers (TINs) to include in their participant list. Previously, ACOs may have benefited from including less efficient TINs in their ACO participant list for the first agreement period, but not the second or later agreement periods.
- ACOs considering joining the MSSP will need to understand how their costs compare to their regional costs before they start their first agreement period rather than prior to their second agreement period.
The effect of these changes ultimately depends on how an ACO’s historical benchmark compares to the regional benchmark. ACOs that have a high market share in their region will continue to see little impact from the regional FFS adjustment because their experience is not excluded from the regional benchmark.
The financial benchmark will continue to not be adjusted based on the efficiency of an ACO's region as compared to national Medicare FFS efficiency levels. This is in contrast to the Next Generation ACO model of the Center for Medicare and Medicaid Innovation (CMMI), where the financial benchmark is adjusted upward for ACOs in "efficient" regions (regions that are lower than national benchmarks) and downward for "inefficient" regions (regions that are higher than national benchmarks). As such, ACOs in lower-cost regions may have greater difficulties identifying financial opportunities in the MSSP as compared to ACOs in higher-cost regions.
Risk score adjustment increases capped at plus 3% with no floor
Risk scores are used to adjust the MSSP benchmark in three ways:
1. Risk adjust each historical benchmark year (BY) to BY3.
2. Risk adjust the regional benchmark to the ACO’s average risk by enrollment type to calculate the regional FFS adjustment.
3. Risk adjust the ACO’s historical benchmark to each performance year.
The first two uses described above continue to apply to full risk score adjustments. For the third use, CMS will no longer cap risk score changes for continuously assigned beneficiaries using demographic scores and will eliminate the distinction between newly and continuously assigned beneficiaries. CMS will now cap overall2 risk score increases at 3%, but risk score decreases will continue to be unlimited. It is important to note that the cap applies to the cumulative risk score adjustment between BY3 and a given performance year.
The implications of these changes for MSSP ACOs include:
- Complete and accurate coding is necessary to maintain an ACO’s benchmark. While this has always been the case, the new rules give additional incentives to ensure proper documentation.
- Coding improvement can lead to a higher benchmark, but only up to the 3% limit. While the risk score adjustment increase is limited to 3%, maintaining or improving coding and documentation may be the difference between shared savings and shared losses for many ACOs.
- The model may not fully account for significant population changes due to the 3% risk score adjustment cap. This could hurt an ACO if the population changes increase costs. In contrast, population changes that decrease costs will be fully reflected in the benchmark, to the extent those population changes are captured in the performance year risk score.
With agreement periods now lasting five years, there is the potential for up to seven years of risk score adjustment from the first benchmark year (BY1) to the last performance year (PY5). However, only the cumulative adjustment from BY3 to each performance year is capped at plus 3%. Therefore, significant population changes may occur over the course of the five years of the agreement period and not be fully captured in the risk score adjustment due to the 3% cap.
Trend
Like risk scores, trends are used to adjust all historical benchmark years to BY3 and then BY3 to each performance year. While trends continue to be based on the assignable population and retrospectively determined at the end of each performance year, CMS has replaced the national trend adjustments in Agreement Period 1 and the regional trend adjustments in Agreement Periods 2 and later with a blend of regional and national trends for all agreement periods. When blending the regional and national trends, the national trend is now weighted by the ACO’s average market share in its region, and the regional trend receives the remaining weight. For example, the trend for an ACO with 70% market share is weighted 70% national trend and 30% regional trend.3
These changes affect both how the ACO benchmark is constructed, i.e., how costs are trended to BY3, as well as how the benchmark is adjusted to each performance year. The effect on individual ACOs will depend on their market share and the relationship between the trends in their region and the national trends. In general, ACOs with high market share (e.g., greater than 50%) can expect to have a benchmark trend primarily based on national trends while ACOs with low market share can expect to have a benchmark trend primarily based on regional trends.
Key implications include:
- Although the risk for high market share ACOs negatively impacting their own benchmark through strong performance is partly mitigated, reverting to a national trend adjustment reintroduces some of the original challenges of the MSSP’s national trend adjustment (e.g., misalignment in national and regional fee schedule trends).
- The MSSP trend target continues to be retrospective in nature. Therefore, ACOs will not fully understand their savings or loss position until well after the end of the performance year.
- ACOs in regions with high participation in Medicare risk sharing programs (e.g., MSSP and Next Generation ACO) may see lower regional trends and therefore a lower financial benchmark.
Conclusion
Under the MSSP final rule, an ACO’s financial benchmark will continue to be largely based upon the ACO’s prior experience. However, the changes in the MSSP’s financial benchmark methodology will have significant implications for most ACOs. Given the increase in the agreement period length from three to five years, it is critical that ACOs assess how the final rule will affect their financial benchmark and related strategies.
MSSP Financial Benchmark Basics
The MSSP financial benchmark is the cost target used to measure each ACO’s financial performance. The sharing of savings or losses is based on how the ACO’s costs (under the Medicare fee-for-service payment schedules) compare to the financial benchmark.
The financial benchmark is based on the ACO’s costs for the three benchmark years prior to the start of each agreement period. Benchmark years 1, 2, and 3 are referred to as BY1, BY2, and BY3, respectively—with BY3 being the most recent year. The benchmark is based upon adjusting each benchmark year to BY3 and blending each benchmark year into a composite per capita target. The benchmark can also be adjusted based on the BY3 expenditure levels in the ACO's region—this is called the regional FFS adjustment.
Each agreement period is made up of performance years. The first performance year is called performance year 1 or PY1. Savings or losses are shared after each performance year between the ACO and CMS. The sharing of savings or losses depends on the MSSP track that the ACO participates in. Figure 2 provides a simplified view of how the benchmark and performance year 1 settlement is calculated.
Figure 2: Simplified Illustration of Benchmark and Performance Year 1 Settlement
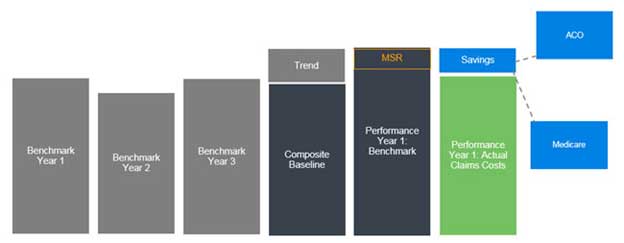
Note: The MSR is the “Minimum Saving Rate” an ACO must achieve before it shares in first dollar savings. The MSSP also has a Minimum Loss Rate or MLR. No settlement occurs between the MLR and MSR, but ACOs share in first dollar losses once the savings or loss rate exceeds the MSR or MLR.
This illustration is a simplification for many reasons, including the fact that the benchmark is constructed separately for each enrollment type (aged non-dual, aged dual, disabled, and ESRD), and there are adjustments for risk in addition to trend.
1This could happen for a variety of reasons-- for example, adding a physician who historically billed Medicare under a different Tax Identification Number (TIN) or a physician who began practicing medicine after or during the baseline period.
2Overall risk score increases for each beneficiary type (e.g., “Aged Non-Dual”) will be capped at 3% from the most recent benchmark year (i.e., BY3) to the performance year.
3Note that the national and regional trend blending weights are calculated separately for each of the four beneficiary enrollment categories. Market share is calculated for each of the ACO’s service area counties and then is weighted by the proportion of the ACO’s enrollment in each county.