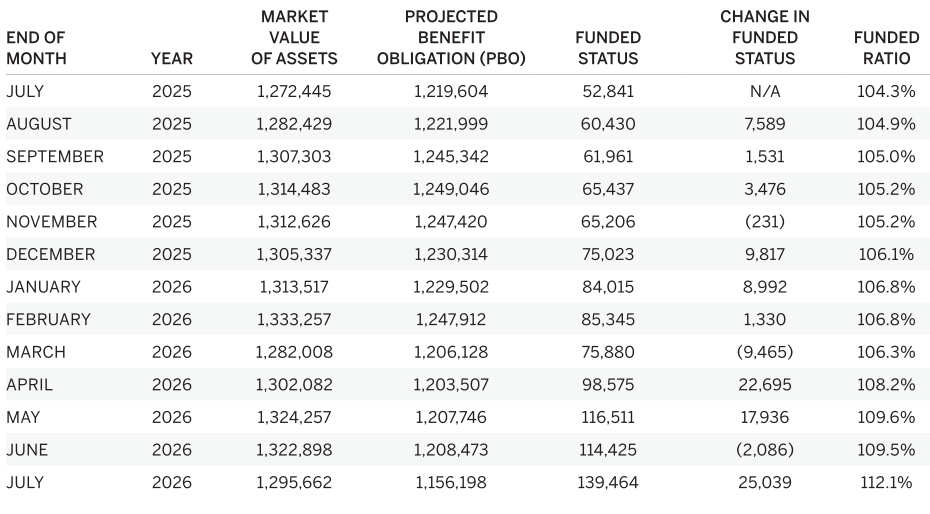
The funded status of the 100 largest corporate defined benefit pension plans grew by $25 billion during July, as measured by the Milliman 100 Pension Funding Index (PFI). A large increase in the benchmark corporate bond interest rates resulted in a $52 billion decrease in pension liabilities. Pension assets also decreased due to investment losses but not nearly enough to offset July’s large liability gain. As a result, the funded status ratio soared to 112.1% as of July 31.
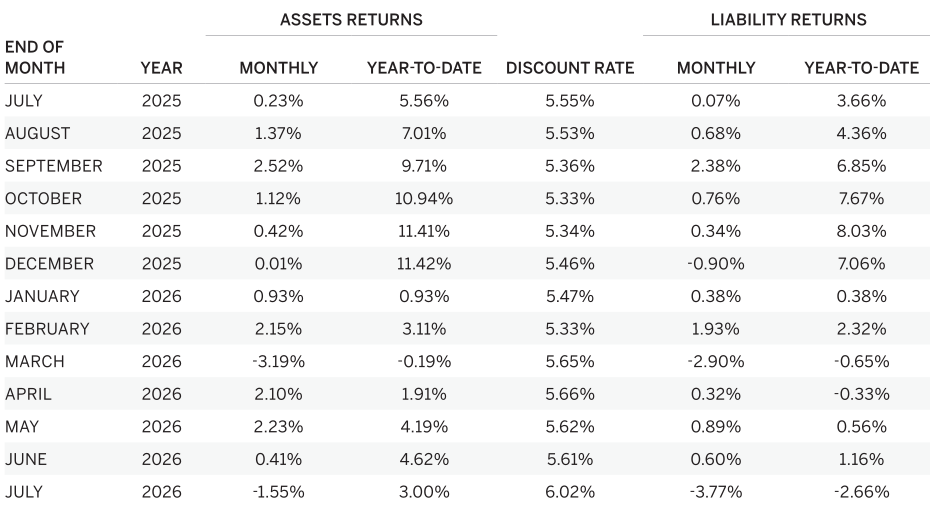
The market value of PFI plan assets decreased by $27 billion because of July’s -1.55% investment return, which was well below expectations. The Milliman 100 PFI asset value fell from $1.323 trillion as of June 30, 2026, to $1.296 trillion as of July 31, 2026. By comparison, the 2026 Milliman Pension Funding Study reported that the monthly expected investment return for fiscal year 2025 was 0.53% (6.61% annualized). The full results of the annual 2026 study can be found at www.milliman.com/pfs.
The Milliman 100 PFI projected benefit obligation decreased to $1.156 trillion during July. The change resulted from a 41-basis-point increase in the monthly discount rate, from 5.61% in June to 6.02% for July. The last time discount rates were north of 6.00% was in October 2023.
Highlights
| $ BILLION | FUNDED PERCENTAGE | |||
|---|---|---|---|---|
| MV | PBO | FUNDED STATUS | ||
| June | 1,323 | 1,208 | 114 | 109.5% |
| July | 1,296 | 1,156 | 139 | 112.1% |
| Monthly change | (27) | (52) | +25 | 2.6% |
| YTD change | (10) | (74) | +64 | 6.0% |
Note: Numbers may not add up precisely due to rounding
Over the last 12 months (August 2025–July 2026), the cumulative asset return for these plans was 8.71%, and the Milliman 100 PFI funded status position improved by $87 billion. The funded status increase was the combined result of positive market returns and discount rate increases. Discount rates experienced a net increase of 47 basis points, to 6.02% from 5.55% one year ago. The funded ratio of the Milliman 100 companies has improved over the past 12 months, to 112.1% from 104.3%.
Figure 1: Milliman 100 Pension Funding Index — Pension surplus/deficit
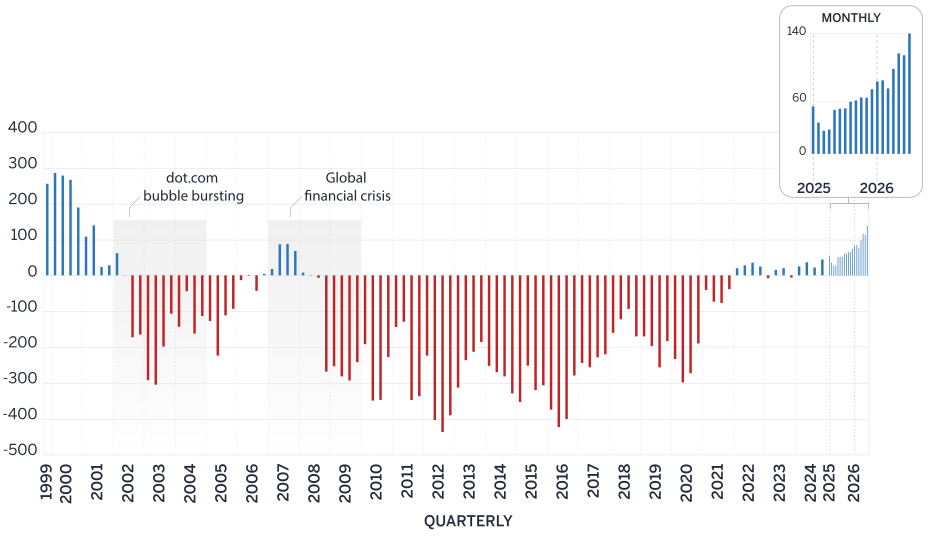
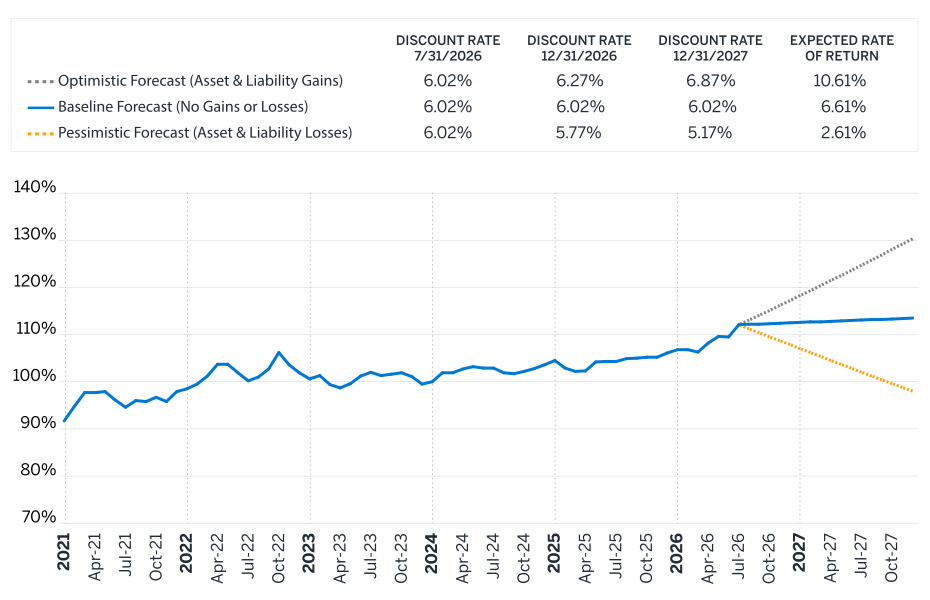
Figure 2: Milliman 100 Pension Funding Index — Pension funded ratio
2026-2027 projections
If the Milliman 100 PFI companies were to achieve the expected 6.61% asset return (as per the 2026 PFS), and if the current discount rate of 6.02% remains unchanged throughout 2026 and 2027, we forecast that the funded status of the surveyed plans will increase. The pension surplus is projected to be $144 billion (funded ratio of 112.5%) by the end of 2026 and $155 billion (funded ratio of 113.5%) by the end of 2027. For purposes of this forecast, we have assumed 2026 and 2027 aggregate annual contributions of $15 billion.
Under an optimistic forecast with rising interest rates (reaching 6.27% by the end of 2026 and 6.87% by the end of 2027) and annual asset returns of 10.61%, the funded ratio is projected to climb to 117% by the end of 2026 and 130% by the end of 2027. Under a pessimistic forecast with similar interest rate and asset movements (5.77% discount rate at the end of 2026 and 5.17% by the end of 2027 and 2.61% annual asset returns), the funded ratio is projected to decline to 108% by the end of 2026 and 98% by the end of 2027.
Milliman 100 Pension Funding Index - July 2026 (all dollar amounts in millions)
Pension asset and liability returns
About the Milliman 100 Pension Funding Index
For the past 26 years, Milliman has conducted an annual study of the 100 largest defined benefit pension plans sponsored by U.S. public companies. The Milliman 100 Pension Funding Index projects the funded status for pension plans included in our study, reflecting the impact of market returns and interest rate changes on pension funded status, utilizing the actual reported asset values, liabilities, and asset allocations of the companies’ pension plans.
The results of the Milliman 100 Pension Funding Index were based on the actual pension plan accounting information disclosed in the footnotes to the companies’ annual reports for the 2025 fiscal year and for previous fiscal years. This pension plan accounting disclosure information was summarized as part of the Milliman 2026 Pension Funding Study, which was published on April 21, 2026. In addition to providing the financial information on the funded status of U.S. qualified pension plans, the footnotes may also include figures for the companies’ nonqualified and foreign plans, both of which are often unfunded or subject to different funding standards than those for U.S. qualified pension plans. They do not represent the funded status of the companies’ U.S. qualified pension plans under ERISA.