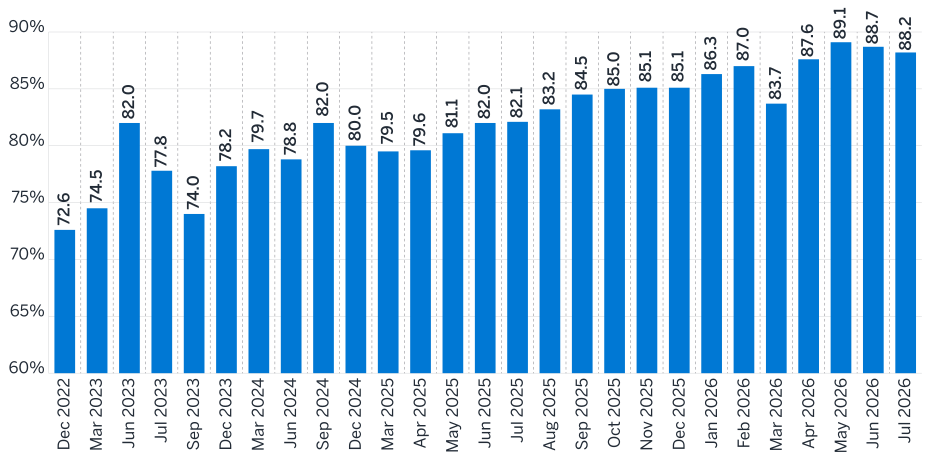
July market declines combined with an increase in liabilities—the same pattern observed during June—to reduce the funded status of the 100 largest U.S. public pension plans, as measured by the Milliman 100 Public Pension Funding Index (PPFI). As of July 31, 2026, the PPFI plans were 88.2% funded, down from 88.7% as of June 30, 2026.
Figure 1: PPFI funded ratio
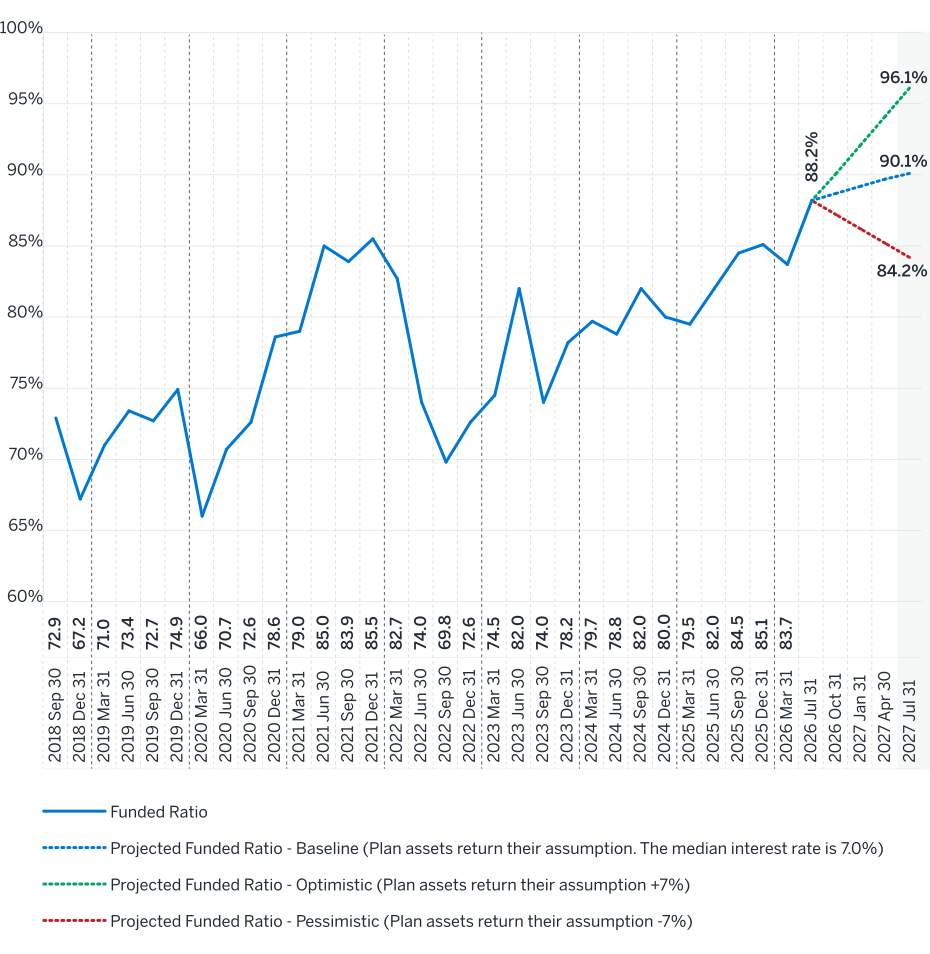
We have projected the aggregate funded status forward from July 31, 2026, to July 31, 2027, under three scenarios. The baseline scenario assumes each plan’s future investment returns equal that plan’s current reported interest rate assumption (median rate = 7.0% in this study). The “optimistic” and “pessimistic” scenarios assume each plan’s investment returns are 7% higher and lower, respectively, than that plan’s current reported interest rate assumption.
Figure 2: PPFI funded ratio with projections
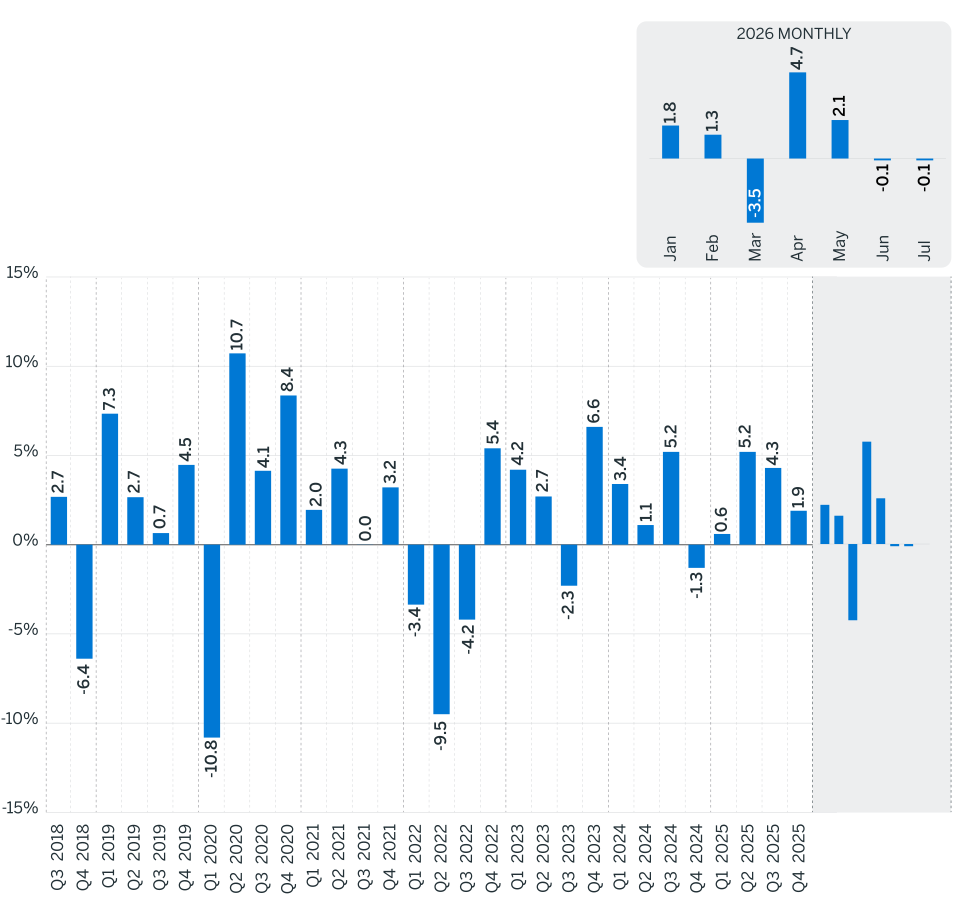
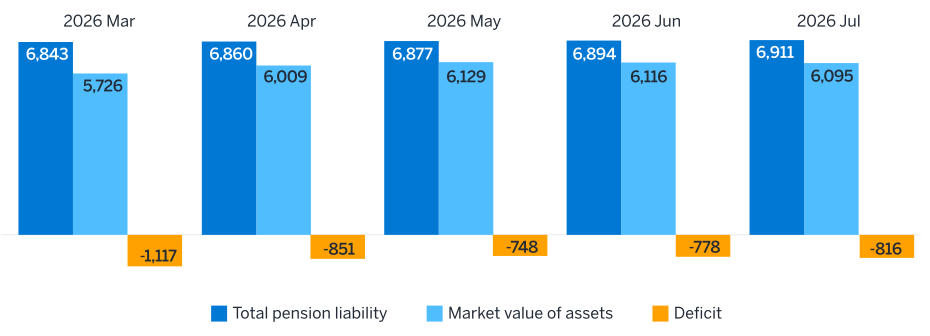
During July 2026, the deficit between the estimated plan assets and liabilities increased from $778 billion at the beginning of the month to $816 billion at the end of the month. The Milliman 100 PPFI asset value decreased from $6.116 trillion as of June 30, 2026, to $6.095 trillion as of July 31, 2026. During July, the plans lost market value of approximately $13 billion, on top of a net negative cash flow of approximately $8 billion. In aggregate, we estimate the PPFI plans experienced investment returns of -0.1% in July, with individual plans’ estimated returns ranging from -2.1% to 1.2%. The aggregate return on assets for the 2026 calendar year-to-date (January through July) is 6.1%.
Figure 3: PPFI investment returns
The total pension liability (TPL) continues to grow and stood at an estimated $6.911 trillion as of July 31, 2026, up from $6.894 trillion as of June 30, 2026. Just as pension assets grow over time with investment income and shrink over time as benefits are paid, so too does the TPL grow over time with interest and shrink as benefits are paid. The TPL also grows as active members accrue pension benefits.
Figure 4: PPFI funded status
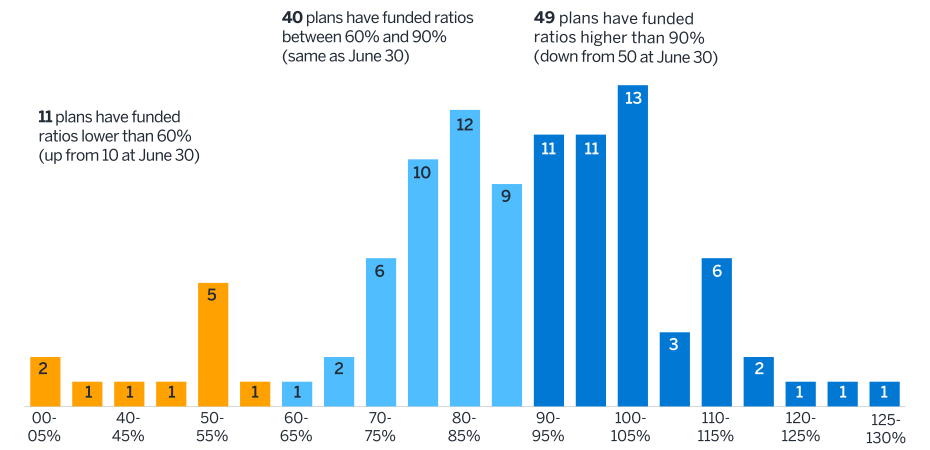
Despite July’s relatively static asset returns, one plan dropped below the 90% funded mark as of July 31, 2026; now, 49 plans stand above this benchmark compared to 50 as of June 30, 2026. Meanwhile, at the lower end of the spectrum, one plan dropped below the 60% funded level, bringing the total number of plans under this mark to 11, up from 10 as of June 30, 2026.
Figure 5: Funded ratios at July 31, 2026
About the Public Pension Funding Index
This update is an estimate based on Milliman’s 2025 Public Pension Funding Study and was updated for market returns from June 30, 2025, to July 31, 2026. The 2025 annual study encompasses adjustments made as of June 30, 2025, and reflects updated publicly available asset and liability information gathered for the annual study.