We are pleased to summarize key year-end 2025 financial results for domestic U.S. General Aviation (USGA) admitted market insurers. This review includes data from the “Aircraft (All Peril)” line of business within the statutory annual statement obtained from S&P Global Market Intelligence, along with other sourced information. We excluded insurers with surplus line eligibility or domestication, which comprise the majority of the market for U.S. large aviation risk, such as airline and major product liability. As a result, we believe the data we reviewed provides the best publicly available snapshot for the performance of the USGA market. We have compiled various metrics for the industry, categorized by:
- Written premium
- Underwriting results
- Incurred losses
As a note, “incurred losses” within this report includes both loss and defense and cost containment expenses (DCCE). Additionally, we modified the admitted market’s incurred losses within our review period for select insurance companies that reported favorable development due to the takedown of reserves from the terrorist attack events on September 11, 2001 (9/11).
USGA written premium for 2025
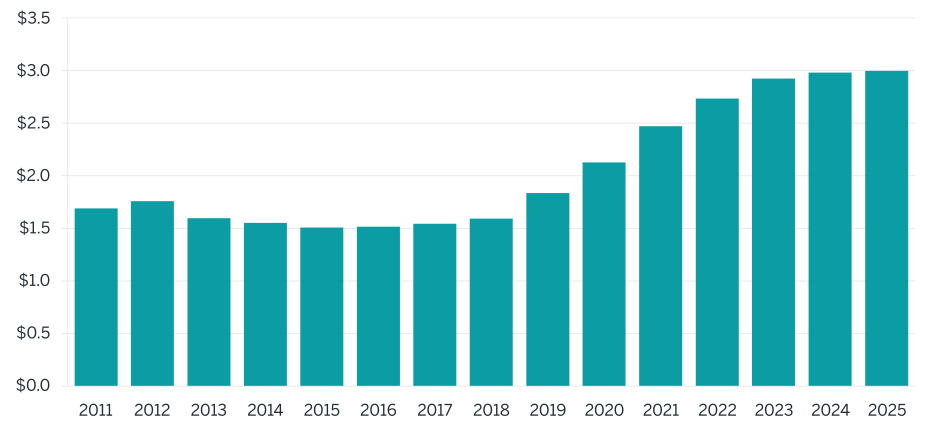
The USGA admitted market reported $3.0 billion in direct written premium in 2025 (see Figure 1). This amount is 0.5% higher than 2024, effectively putting the brakes on several consecutive years of premium growth. We suggested in last year’s article that full year 2025 premiums may be flat, based upon our analysis of data reported through June 30, 2025. Using this same approach to forecast USGA written premium for the entirety of 2026, second quarter 2026 results showed signs of a decline—conceivably in the low- to mid-single digits on a percentage-point basis.
Figure 1: Direct written premium ($ billions)
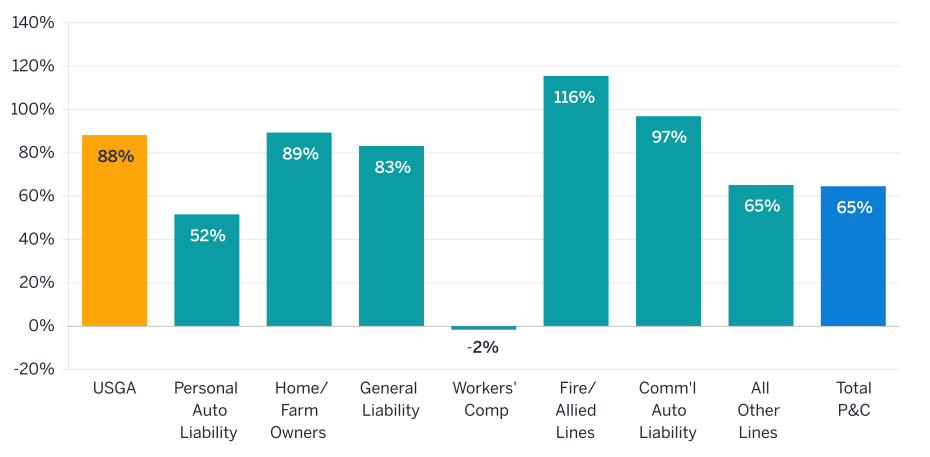
In total, the USGA market witnessed an 88% cumulative surge from the $1.6 billion reported by insurers between 2018 and 2025. This growth period represents the largest increase in written premium since the era immediately following 9/11. To put this growth into a broader perspective, Figure 2 compares the USGA market to other property/casualty (P&C) lines of business over this same time frame. While USGA growth outpaced the total P&C market during this period, another noteworthy takeaway relates to other lines of business with similar or higher growth rates. These segments have either experienced increased risk from climate change (homeowners/farmowners and fire/allied) or are generally considered to be in the crosshairs of social inflationary pressures (general liability and commercial auto liability). As discussed in a subsequent section, we believe the USGA market has been and continues to be exposed to both of these factors, which lead to higher claim costs and in turn higher premiums.
Figure 2: Direct written premium growth by line of business (2018–2005)
Federal Aviation Administration (FAA) data shows that although total estimated active aircraft has been consistent over the previous decade (see Figure 3), the active fleet is forecast to grow at 0.6% per annum through 2046 (a slight upward revision from the prior report’s forecast of 0.5%).1 Not every segment is projected to grow at the same rate, as the FAA’s figures project declines in the fixed-wing piston fleet will be more than offset by increases in fixed-wing turbine, rotorcraft, experimental, and light sport aircraft fleets.
Figure 3: FAA estimated exposure; all aircraft types
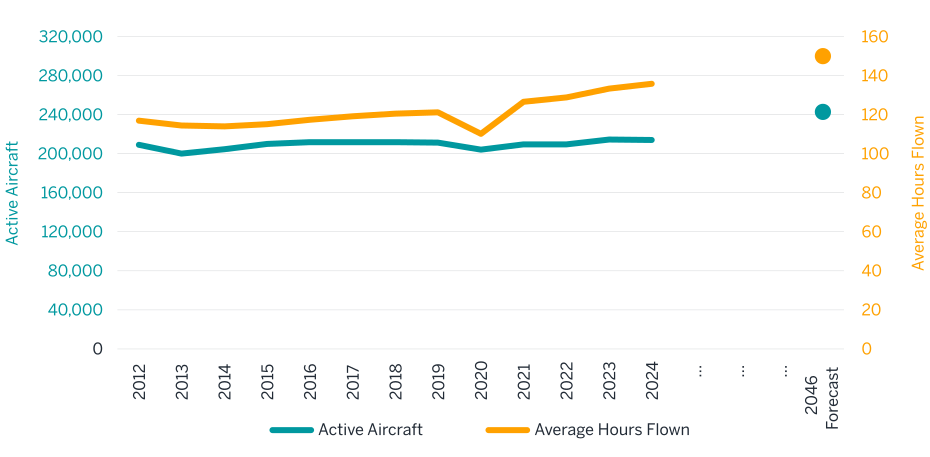
The FAA also gathers data regarding the estimated number of general aviation hours flown, which we converted in Figure 3 to be the average hours flown per active aircraft. Ignoring the 2020 pandemic year, this ratio has consistently risen over the previous decade and is expected by the FAA to continue its upward trajectory through 2046 at a rate of 0.5% per annum (a rise from 0.3% from the prior report’s forecast). The FAA forecasts that fixed-wing piston average hours will decrease due to an aging fleet, whereas turbine (including rotorcraft) and jet aircraft are the drivers behind the prospective overall increase.
Going forward, the FAA’s forecast of modest annual exposure growth in both active aircraft and total hours flown of 1.0% (equal to [1 + 0.6%] × [1 + 0.5%] − 1) may provide insight as to the source of any substantial USGA market growth—rate changes in response to the claims environment rather than a significant change in exposure.
The USGA market has always represented a small slice (less than 0.5%) of the total P&C insurance industry, which is dominated by homeowners, private passenger and commercial auto, and general liability lines of business. Insurers with at least $1 million in annual aircraft premiums derive, on average, approximately 5% of their business from the USGA market, meaning that carriers in this space are principally multiline writers. In addition, as aircraft policies can protect against losses in the hundreds of millions of dollars, USGA insurers tend to cede a significant portion of business (approximately 50% of premium) to the reinsurance market. These risk transfer mechanisms diversify the concentration of aircraft perils on any given insurer’s book of business, which can serve to reduce overall solvency risk.
USGA underwriting results
Poor underwriting results in the late 2010s were the catalyst for the USGA market’s recent firming. From 2016 through 2020, the market lost approximately $700 million on an underwriting basis (i.e., excluding investment income), as displayed in Figure 4. In 2019 alone, the market lost nearly $300 million on $1.8 billion in premium. The aforementioned rate increases toward the end of this period of unprofitability guided the USGA market to small underwriting profits each year since. The 2023 through 2025 underwriting income represents a return to the profit level experienced by the industry in the years leading up to 2016. This perceived stability in underwriting results may also be a driving force for the market’s plateaued premiums.
Figure 4: Underwriting results ($ millions)
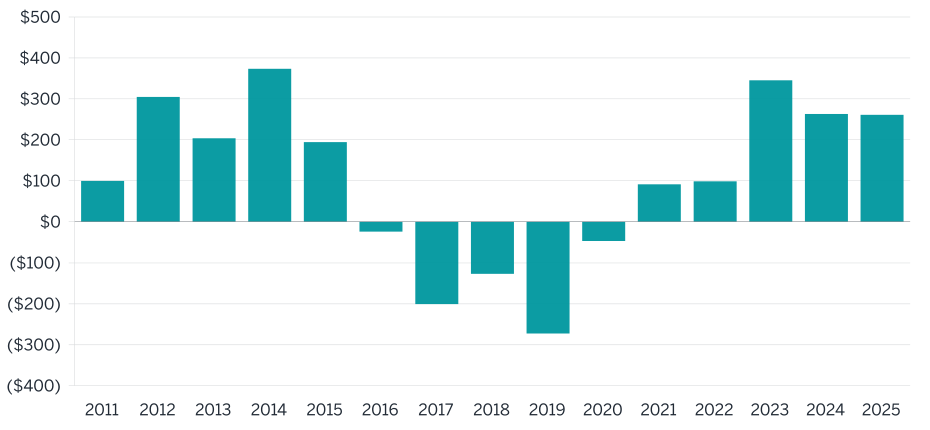
For a longer-term view, the post-9/11 rate increases led to 14 consecutive years of underwriting profitability for the market (2002 through 2015). Thus, after nearly $700 million in losses between 2016 and 2020, the underwriting profits in 2021 through 2025 have demonstrated that profitability may once again be trending in the right direction for long-term sustainability. It should be noted, however, that the market’s 4% profitability level in 2021 and 2022 (measured as a percentage of earned premium) lagged materially behind the USGA admitted market’s post-9/11 historical average. After adjusting for premium growth, the 2023 through 2025 profit levels were relatively consistent with results from years prior to the period of underwriting losses.
From a market cycle perspective, multiple years of double-digit premium growth (see Figure 1) and a return to underwriting profitability (see Figure 4) are hard-market characteristics that typically entice new market entrants. Although some movement of companies in and out of various P&C lines of business is not abnormal, the USGA market includes some natural barriers to entry—most notably the need for a highly specialized underwriting team and expertise in placing sufficient reinsurance. Our review of the USGA market shows that of the 30 companies writing at least $10 million of premium in 2025, seven entered the market after 2019 and have a combined 2025 market share of just 6%. Some of these market gains, however, are attributable to insurers that left the market in the last few years, perhaps due to underwriting losses in the segment or better opportunities in other lines of business. Given the available data, it does not appear to us that new insurers have flooded the USGA market to date.
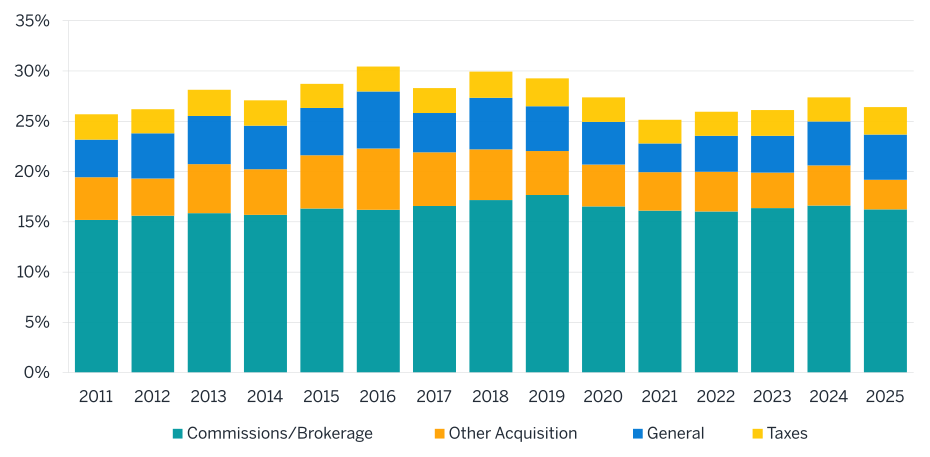
Underwriting expenses have remained stable for over 15 consecutive years, landing between 25% and 30% of premium (see Figure 5). As noted in last year’s article, the ratio had been slowly increasing since the 2021 nadir, which coincided with the recent slowdown in premium growth. The 2025 ratio, however, provided some relief due to a multidecade low in the somewhat volatile other acquisition component. Absent this relief, the 2025 ratio would have been on par with 2024. Certain of these expenses—agent commissions, brokerage fees, and taxes—are tied to premium volume and are more stable in ratio form. The recent deterioration is therefore attributable to general expense dollars, which set another all-time high and have consistently risen over time.
Figure 5: Underwriting expense ratio
USGA incurred losses in 2025
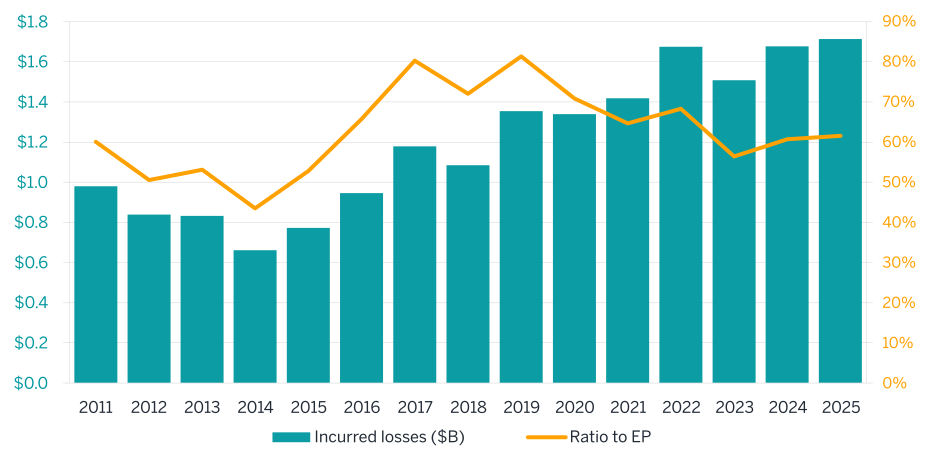
Incurred losses reached a 23-year high in 2025, coming in at $1.7 billion and continuing a general trajectory that has witnessed losses climb an average of 9.0% year-over-year since 2014 (see Figure 6). As described earlier, both USGA written premiums and FAA-indicated measures of exposure held steady between 2014 and 2018. Therefore, the rapid rise in incurred losses during this time was not driven by increasing exposure but rather stemmed from a worsening claims environment that produced calendar year loss ratios well above pricing targets. Figure 6 illustrates the deteriorating calendar year loss ratios during this time, followed by improvements in the loss ratio as premiums increased. We consider this period of rapidly rising losses to be a leading indicator for rate hikes that occurred a few years later.
Although the calendar year 2023 through 2025 loss ratios are generally consistent with the post-9/11 years through 2015, claim costs continue to pose a challenge for the USGA industry. Although premiums were mostly flat in 2023 through 2025 (and projected to decline somewhat in 2026), losses have not followed suit and may be putting upward pressure on existing rate adequacy. Considering the expected loss trend along with flat-to-declining premiums, we would not be surprised to see a five percentage-point jump in the calendar year 2026 loss ratio. We may then look back at the 2023 through 2026 period as the leading indicator of future rate increases.
Figure 6: Calendar year incurred losses ($ billions)
Rising losses are caused by increases in claim frequency and/or severity, so which component is primarily driving the losses?
Claim frequency
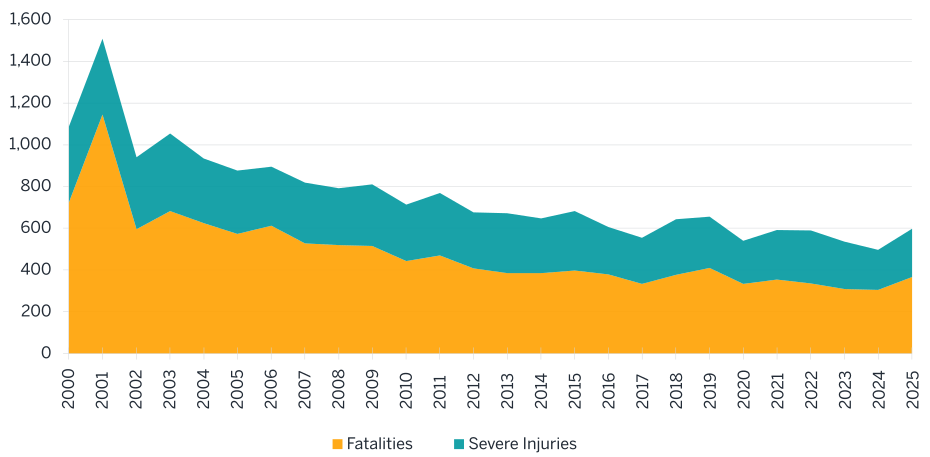
National Transportation Safety Board (NTSB) U.S. data shows that both fatalities and severe injuries have generally trended lower since 9/11 (see Figure 7).2 Combined fatalities and severe injuries reported in 2025 were above 2023 and 2024 figures but remained at a level consistent with the prior 10-year period. The use of NTSB head counts as a proxy for liability-based frequency is reasonable, and this data suggests that the frequency of liability-based events is not driving the decade-long increases to incurred losses.
figure 7: ntsb number of aircraft fatalities and severe injuries
Figure 7: NTSB number of aircraft fatalities and severe injuries
Besides liability, USGA policies typically cover the cost of repair or replacement of aircraft due to adverse weather events, such as hurricanes, tornadoes, hail, wind, and heavy snowfall. As discussed above, weather-related losses are on the rise and may continue to increase in frequency but do not alone explain the magnitude of the multiyear upward trend in incurred losses.
Severity on liability claims
Claim inflation continues to be an increasing problem for the P&C insurance industry, and the aviation market is not immune to these trends. Given the relatively high policy limits provided in certain general aviation segments, the risks of social inflation (e.g., an increased tendency to both broaden contract interpretations and punish those who cause injury to others) and runaway verdicts are of particular concern. U.S. juries have been awarding significantly higher sums in recent years, and these verdicts have a spiraling effect, leading to higher plaintiff demands and increased costs of settlements to avoid jury trials. USGA claims reserved using historical loss values may be under-reserved based on recent claim trends, which can impact profitability because any adverse reserve development on claims in older accident years will suppress profitability levels in the current year.
Although we are not aware of a publicly available analysis specific to USGA claim severity trends, we have observed the unmistakable impact of social inflation within multiple liability lines of business, as noted above, including commercial auto liability and commercial general liability (specifically excess and umbrella coverages). Of particular note is the timing of acceleration in these liability results, which closely mirrors the period in which USGA incurred losses saw rapid growth.
Severity on hull claims
Working with the same FAA data referenced above, we have observed since at least 2006 that the average age of USGA active aircraft has been steadily increasing each year by approximately six months. Fixed-wing piston aircraft, both single-engine and two-engine, comprise the oldest average fleet age and are also the primary drivers of the aging because active aircraft in this timeframe were not retiring at a rate that offset new deliveries.
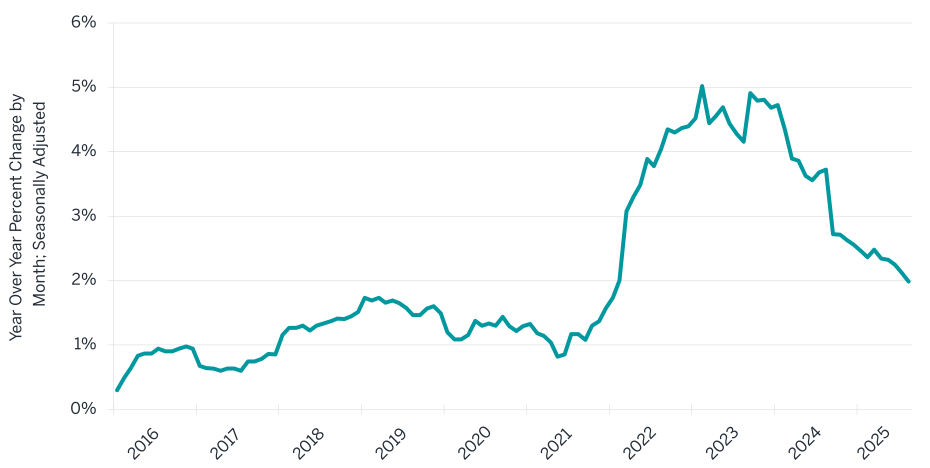
Newer generation aircraft are made with composite materials that are much more expensive to repair than aircraft of previous generations. They require proprietary bonding techniques and specialized equipment, which significantly reduces the number of entities with the expertise or equipment to make the repairs. Recent inflation has impacted the aviation industry as well. Figure 8 displays the monthly increase in aircraft costs relative to 12 months prior.3 It should be noted that although the current inflationary level is lower than that experienced between 2022 and 2024, prices have not subsequently dropped since the rate of change continues to be above 0%. We therefore remain in an environment above the levels experienced during the first several years of deterioration observed in USGA’s incurred losses.
Figure 8: Producer price index for aircraft and aircraft equipment (relative to 12 months prior)
USGA market: Looking ahead
The USGA insurance market had been highly competitive for a number of years, with USGA policyholders benefiting from reduced premiums and competitive rates until around 2019, at which point rates in the market began to harden. We see some indications that USGA insurers continue to progress through the market cycle—years of premium hikes beginning to stabilize, loss ratio relief, and a return to long-term profitability levels. However, the rising frequency and severity of weather-related events and the increasing uncertainty of the broader liability environment—both of which can disproportionately impact reinsurers’ bottom lines and future capacity—continue to be significant challenges for USGA insurers and may not be fully contemplated from a pricing perspective.
Although underwriting expense ratios have been relatively consistent within our review period, the recent slowdown in premium growth may continue to put pressure on the expense ratio and general expenses in particular, which have risen nearly 50% for USGA carriers since the pandemic. We tend to consider these “people costs,” and they have notably increased post-pandemic across the broader P&C industry as well.
All considered, our analysis indicates that the USGA insurance market has taken the necessary steps in recent years to return to profitability. Although premium growth has flattened and may shrink in the near term, significant risks in both claim costs and reinsurance capacity have increased the uncertainty of this market and may ultimately lead to another period of rate increases.
Milliman is one of the largest independent consulting firms in the world and has pioneered strategies, tools, and solutions worldwide. We are recognized leaders in the markets we serve, including USGA for more than two decades, where we provide expertise in both reserving and rating plan development to assist clients with financial reporting and underwriting functions. Clients know they can depend on us as industry experts, trusted advisers, and creative problem-solvers. Contact Carl, Mindy, or Andy to learn more.
1 FAA. (September 25, 2026). General Aviation and Part 135 activity surveys. U.S. Department of Transportation. Retrieved September 25, 2026, from faa.gov/data_research/aviation_data_statistics/general_aviation/; FAA. (n.d.) FAA aerospace forecast: Fiscal years 2026–2046. Retrieved October 19, 2026, from https://www.faa.gov/data_research/aviation/aerospace_forecasts/FY_2026-2046_Full_Forecast_Document_Tables.pdf.
2 NTSB accident data retrieved September 25, 2026, from Case Analysis and Reporting Online (CAROL), available at https://data.ntsb.gov/avdata/.
3 U.S. Bureau of Labor Statistics, retrieved from Federal Reserve Bank of St. Louis (FRED). (n.d.). Producer price index by commodity: Transportation equipment: Aircraft and aircraft equipment [WPS142]. Retrieved October 19, 2026, from https://fred.stlouisfed.org/series/WPS142.