Milliman analysis highlights the stormy ride thus far in 2020 for multiemployer plans
Milliman’s June 2020 Multiemployer Pension Funding Study is an interim update to our annual study published in the first quarter of the year.1
This study updates the estimated funded status of U.S. multiemployer plans as of June 30, 2020, showing the change in funding levels from December 31, 2019.
Key findings
- The estimated investment return for our simplified portfolio for the first six months of 2020 was about -1.3%, a significant recovery from the -13.4% return at the end of March.
- The aggregate funded percentage for multiemployer plans is estimated to be 82% as of June 30, 2020, down from 85% at the end of 2019.
- The market volatility and economic uncertainty associated with the COVID-19 pandemic has resulted in dramatic swings in plans’ funding status over the last six months.
- While all plans absorb market gains and losses over time, extreme market movements immediately prior to a plan’s measurement date can have a significant impact on its funding position and annual Pension Protection Act (PPA) zone status.
Figure 1: Aggregate funded percentage (in $ billions)
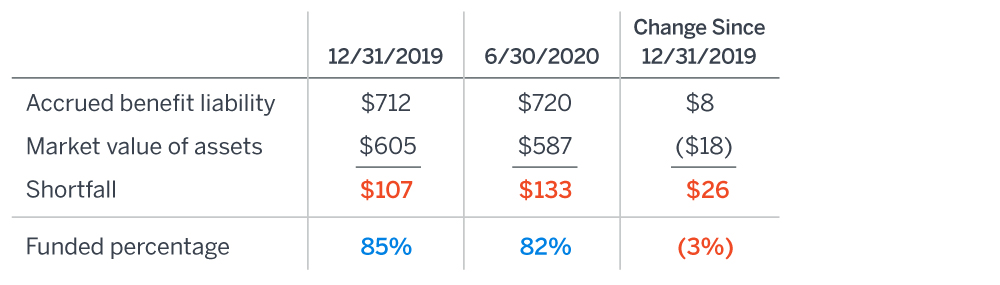
Based on plans with complete IRS Form 5500 filings. Includes 1,249 plans as of December 31, 2019, and 1,245 plans as of June 30, 2020.
Current funded percentage
Figure 1 shows that the funding shortfall for all plans rose by about $26 billion for the six-month period ending June 30, 2020, resulting in a drop in the aggregate funded percentage from 85% to 82%.
A key assumption here is the discount rate used to measure liabilities, with each plan using its actuary’s assumed return on assets. Assumed returns generally fall between 6.0% and 8.0%, with a weighted average interest rate assumption for all plans of about 7.0%. This analysis also uses the market value of assets, which paints a clearer current financial picture than using smoothed “actuarial” asset values.
Historical funded percentage
Figure 2 shows the aggregate historical funded percentage of all multiemployer plans since the end of 2007 by their current zone statuses. For example, the green line shows the historical funded percentages of plans currently in the green zone (without regard to previous zone statuses). The blue dotted line represents all plans combined.
Figure 2: Aggregate historical funded percentage, by current zone status
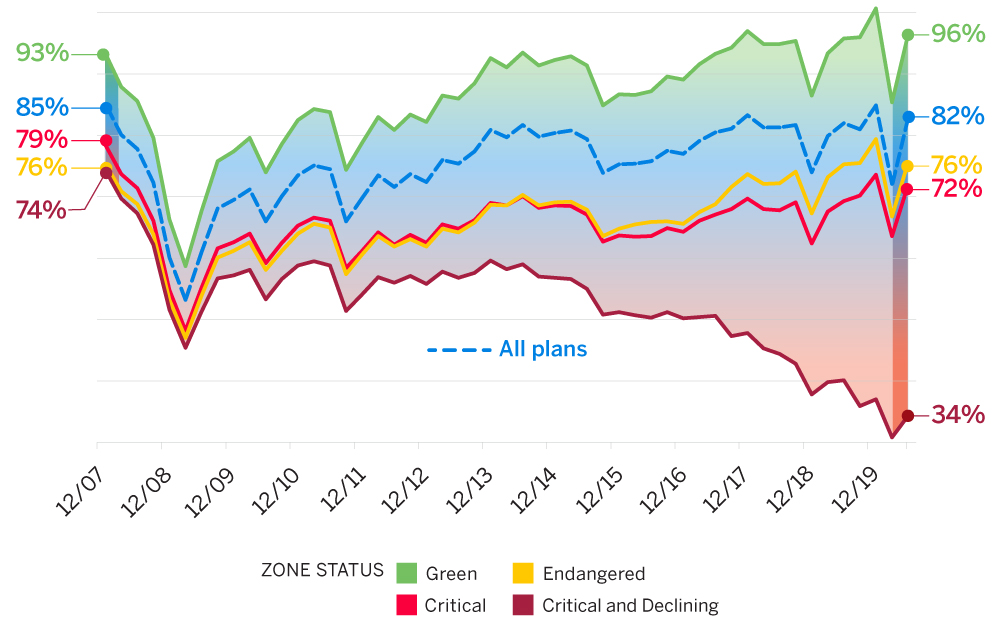
Over the past 18 months, increased volatility in the markets has caused dramatic swings in the aggregate funded percentage for most plans. Our simplified portfolio earned about -1.3% in the first six months of 2020, but the return was as low as -13.4% through March 2020. Plans in critical and declining status continue to see their funded statuses creep downward over time regardless of the market’s recovery. This is because investment returns apply to smaller asset values as well as some plans earning lower returns due to shifts in policy to invest in safer, lower-return investments in an effort to preserve capital as long as possible. The funded percentage of noncritical and declining plans continues to be almost entirely driven by investment performance.
Measurement dates matter
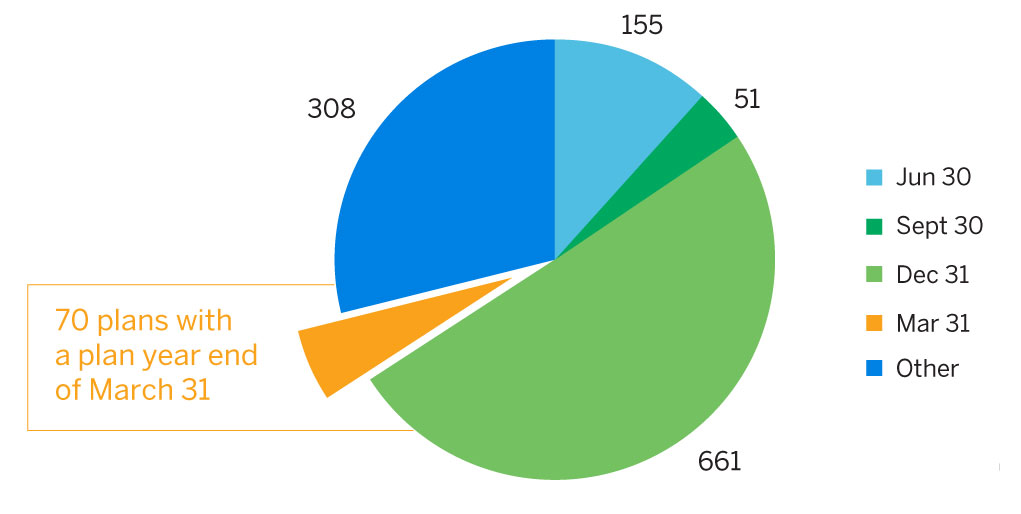
The numbers in Figure 1 above show the snapshot funded statuses for all plans as of this study’s customary semiannual dates (December 31 and June 30). While the decrease in funded status is concerning, it is worth noting that intermediate figures as of March 31, 2020, were substantially worse. We estimate the funding shortfall as of March 31, 2020, was approximately $200 billion with a funded status of 72%. While the bounce-back from the bottom of the market in March is welcome news, 70 plans have the misfortune of having a March 31 plan year-end date. In their cases, annual valuations and zone certifications will include asset values measured at the worst possible time so far this year. Calendar year plans will be crossing their fingers that the recovery continues although, as discussed in recent articles,2, 3 the path of the pandemic moving forward remains uncertain.
Figure 3: Number of plans by plan year end
Impact of the economy
The market volatility associated with the COVID-19 pandemic and the slow and inconsistent nature of states reopening from the shutdown leaves the future of multiemployer plans in a tenuous position. Some industries, such as hospitality, have been devastated by recent lockdowns, with some businesses closing for good. Other industries, such as construction, have weathered the storm so far, and are hopeful that work levels do not undergo declines in the next year or two once existing projects are completed.
What lies ahead?
Lawmakers have been active in passing stimulus legislation to help the economy and provide financial assistance to individuals who have lost their jobs. The plight of multiemployer plans has not gone unnoticed, with the House of Representatives passing the Health and Economic Recovery Omnibus Emergency Solutions (HEROES) Act on May 15, 2020.4 The act contains several proposals to address some of the challenges for multiemployer plans. However, the Senate has yet to consider the HEROES Act or introduce its own version of a bill. Once all ideas are on the table, Congress will need to find a bipartisan solution to the multiemployer pension crisis. What that will look like remains in question.
The last six months have been extremely turbulent and while the market has recovered some, there remains considerable economic and political uncertainty ahead.
About this study
The results in this study were derived from publicly available Internal Revenue Service (IRS) Form 5500 data as of June 2020 for all multiemployer plans, numbering between 1,200 and 1,300, depending on the measurement date used. Data for a limited number of plans that clearly appeared to be erroneous was modified to ensure the results were reasonable and a sufficiently complete representation of the multiemployer universe.
Liability amounts were based on unit credit accrued liabilities reported on Schedule MB, and were adjusted to the relevant measurement dates using standard actuarial approximation techniques. For this purpose, each plan’s monthly cash flow, benefit cost, and actuarial assumptions were assumed to be constant throughout the year and in the future. Projections of asset values to the measurement date reflect the use of constant cash flows and monthly index returns for a simplified portfolio composed of 45% U.S. equities, 20% international equities, and 35% U.S. fixed income investments.
Significant changes to the data and assumptions could lead to much different results for individual plans but would likely not have a significant impact on the aggregate results or the conclusions in this study.
1The Multiemployer Pension Funding Study of December 2019 is available at https://us.milliman.com/en/insight/ multiemployer-pension-funding-study-december-2019.
2Coffing, K.S., Connor, T.L., & Lantz, N.M. (April 2020). COVID-19 to Leave Multiemployer Pension System More Distressed Than Ever. Milliman Multiemployer Review: https://us.milliman.com/en/insight/covid-19-toleave- multiemployer-pension-system-more-distressed-than-ever.
3Preppernau, L.E. & Vaughn, C. (March 2020). Can Multiemployer Pension Plans Survive COVID-19? Milliman Multiemployer Alert: https://us.milliman.com/en/insight/ multiemployer-alert-can-multiemployer-pension-plans-survive-covid-19.
4Milliman Multiemployer Alert (May 2020). Multiemployer Relief in HEROES Act: https://milliman-cdn.azureedge.net/-/media/milliman/pdfs/articles/ multiemployer-alert-heroes-act.ashx.