Introduction: What is the role of housing finance agencies?
State and city-chartered housing finance agencies (HFAs) are organizations that help expand access to affordable homeownership and rental housing across the United States. Beginning in the 1960s, HFAs were created to address gaps in the mortgage market by supporting borrowers who may have difficulty obtaining affordable financing through customary channels.1 They serve an important public purpose by promoting homeownership and rental housing opportunities, specifically for first-time homebuyers, low- to moderate-income households, and borrowers purchasing homes in targeted geographic areas.
HFAs support these goals by working with private lenders to offer programs such as first-time homebuyer assistance, down payment assistance, and multifamily housing finance, often funded through mechanisms such as mortgage revenue bonds. These programs make mortgage financing more accessible by offering lower interest rates, more flexible loan terms, and other forms of assistance that reduce upfront or ongoing housing costs. Through these programs, HFAs help expand access to credit for households that may otherwise be underserved by the traditional mortgage market.
What are key performance indicators for HFAs’ financial health?
For HFAs, performance tracking is essential for managing risk and maintaining long-term financial sustainability. HFAs measure performance using production, credit, servicing, and financial metrics, with the most important indicators varying based on whether they insure loans, service them, or hold loans in portfolio. Because each role exposes the agency to different operational and financial risks, performance monitoring should be tailored to the specific programs and responsibilities of the HFA.
This paper will provide a primer on the metrics HFAs can use to measure financial performance and illustrate how benchmarking and data visualization via customizable dashboards can better inform board-level decisions.
Managing the financial exposure of HFAs: Loan loss reserves and financial preparedness
In many cases, an HFA’s role may include holding loans in portfolio or retaining loan servicing activities; both options can expose an HFA to mortgage loan credit risk. Depending on the structure of its programs, an HFA may originate loans in its name through lender partners and hold them in a bond-financed portfolio, provide credit enhancement or repayment guarantees, or offer subordinate financing through second lien loans. These activities can create varying degrees of financial exposure to borrower default, in addition to the operational, compliance, and reputational risks that come with servicing the loans. When HFAs retain this type of exposure, they generally maintain loan loss reserves to provide for estimated credit losses.
Reserve analysis connects current portfolio performance to future financial preparedness by estimating potential losses under a range of economic and housing market conditions. One of the most important risk indicators is the composition of the delinquent loan inventory. Looking only at total delinquency can mask important differences in risk, so many HFAs segment inventory into 30-day, 60-day, 90-plus-day, bankruptcy, and foreclosure categories. Transitions between these categories can help distinguish temporary borrower stress from deeper credit deterioration by showing whether delinquent loans are curing, remaining delinquent, or progressing toward foreclosure.
Reserve needs can shift materially with delinquency trends, borrower and loan mix, home price movements, interest rates, and broader economic conditions. For that reason, visual reporting is especially valuable for communicating changes in reserve adequacy over time. Key metrics include delinquency counts, transitions between delinquency statuses, foreclosure activity, reserve balances, and changes in reserves relative to the risk profile of the underlying portfolio. For example, the risk monitoring dashboard in Figure 1 shows a hypothetical HFA with a total delinquency rate that has been steadily decreasing for several years. Figures such as this one help HFAs drill down to the core drivers of their portfolio risk. In this case, the decrease is primarily driven by fewer loans becoming 30-days delinquent rather than decreases in inventory for loans in more severe delinquency statuses.
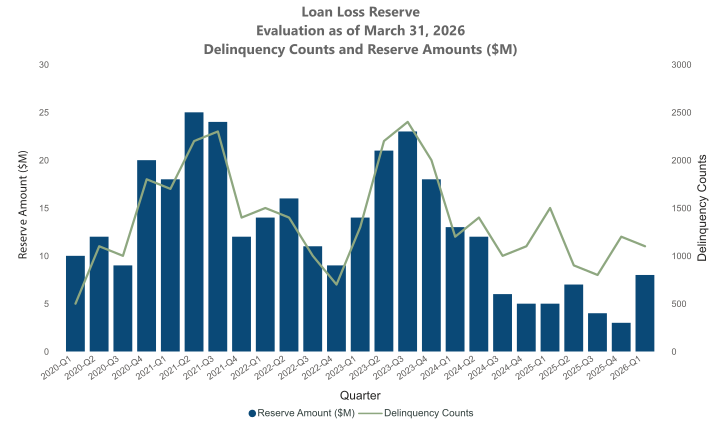
Understanding the relationship between delinquency count and held reserves can also inform decision making by HFA leadership. In Figure 2, the hypothetical HFA has largely adjusted their booked reserves in line with delinquency count changes each quarter. However, recent trends show that reserves have decreased more sharply than delinquency counts. For the HFA, this may indicate the expected loss severity is decreasing or that the total delinquency mix has shifted to less-severe statuses. Monitoring these items via an interactive dashboard is a good way to ensure financial stability and spot emerging trends early on.
Figure 1: Sample dashboard image of total delinquency rate segmented by delinquency status
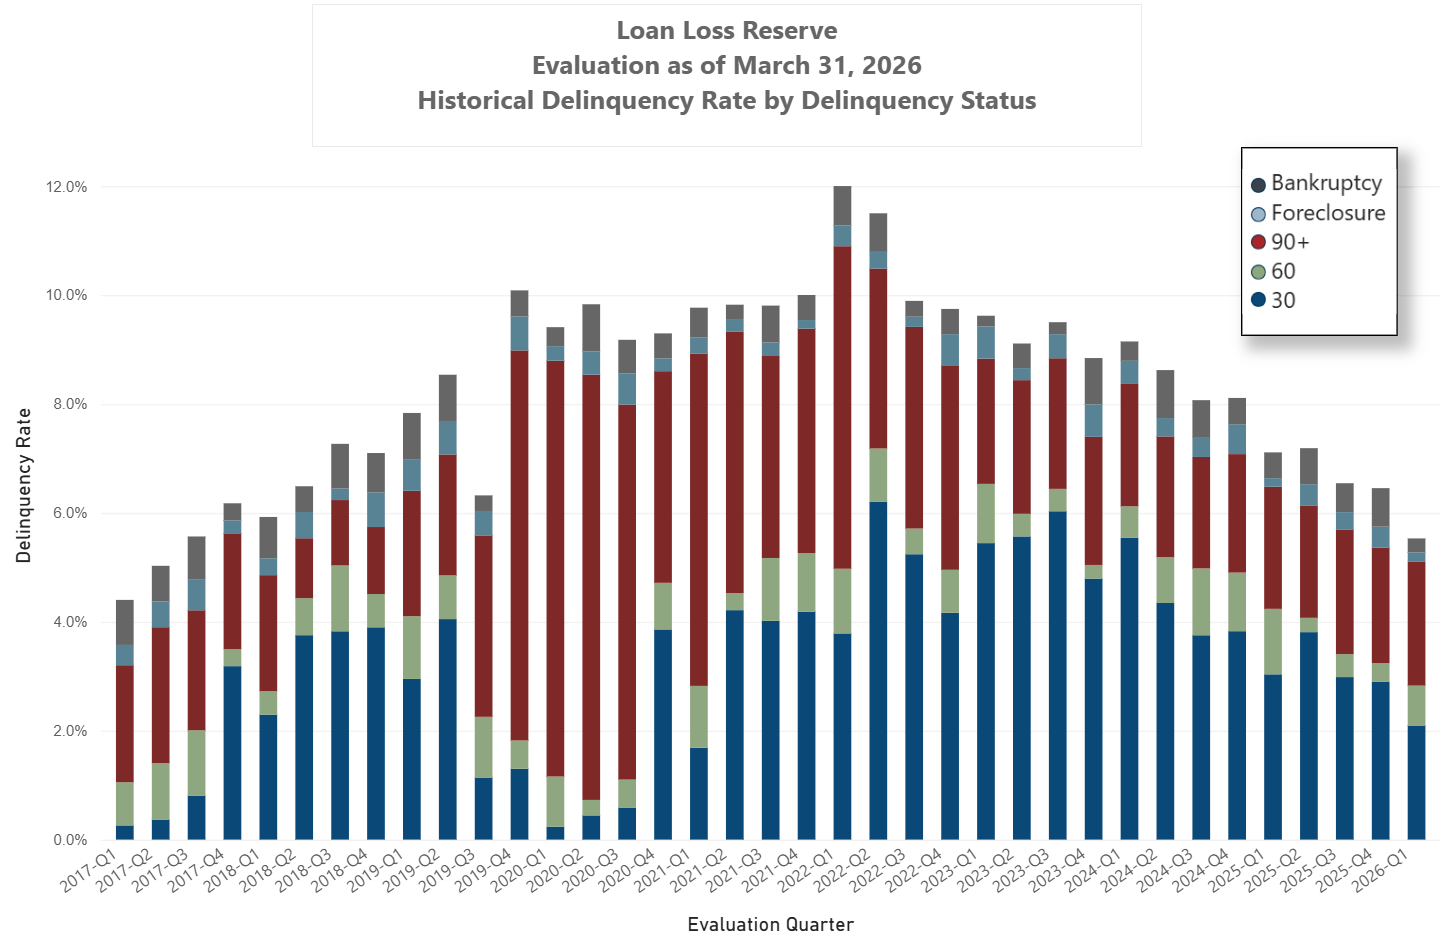
Figure 2: Sample dashboard image of loan loss reserve amount and delinquency count by quarter
Mortgage insurance and credit performance
For HFAs that insure loans, key performance indicators include origination volume, insurance-in-force, delinquency rates, claim rates, cure rates, and loss severity. Insurance-in-force is the outstanding balance of loans covered by the HFA’s insurance program and represents the agency’s total risk exposure. Delinquency rates measure borrower payment performance, while cure rates track the share of loans that fully catch up on payments. Claim rates measure the likelihood of loans resulting in an insurance payout following foreclosure, and, in the event of a claim, loss severity measures the expected financial impact to the insurer.
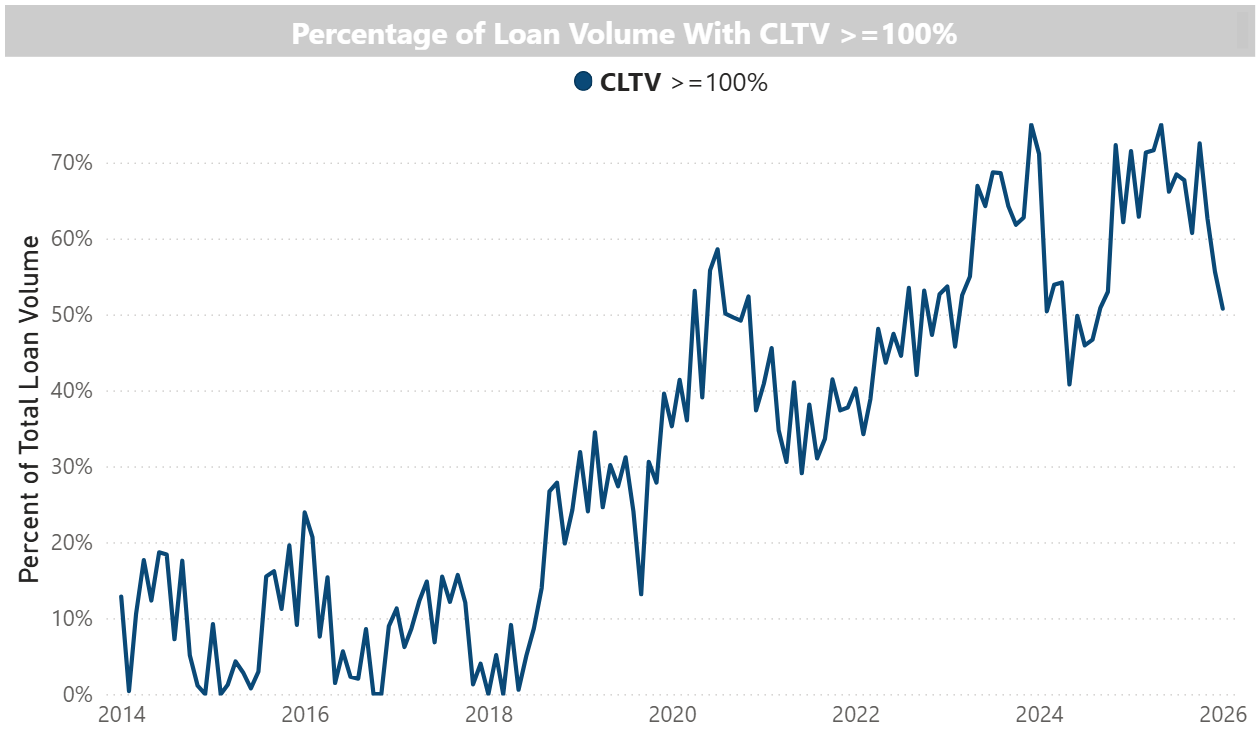
Portfolio composition also matters, since risk characteristics such as credit score, product type, debt-to-income ratio (DTI), combined loan-to-value ratio (CLTV), geography, occupancy, and vintage can all influence expected performance. Credit score and DTI provide insight into borrower credit quality and ability to manage monthly payments. If the portfolio mix is shifting toward borrowers with lower credit scores or higher DTI, that represents increased risk for the HFA. CLTV indicates the amount of borrower equity and potential loss exposure in the event of default. A higher CLTV means the borrower has less skin in the game and makes their default likelihood more vulnerable to economic downturns. Other factors, including product type, occupancy, geography, and loan vintage, help identify differences in borrower behavior, property risk, market conditions, and performance across economic cycles. Monitoring the distribution of loans across these characteristics, as well as how that distribution changes over time, can help identify whether shifts in business mix are increasing or decreasing portfolio risk. Detailed visualizations like Figures 3 and 4 help bring these risk changes to the forefront so management can react during critical times.
Figure 3: Sample dashboard image of mix of DTI for a hypothetical HFA
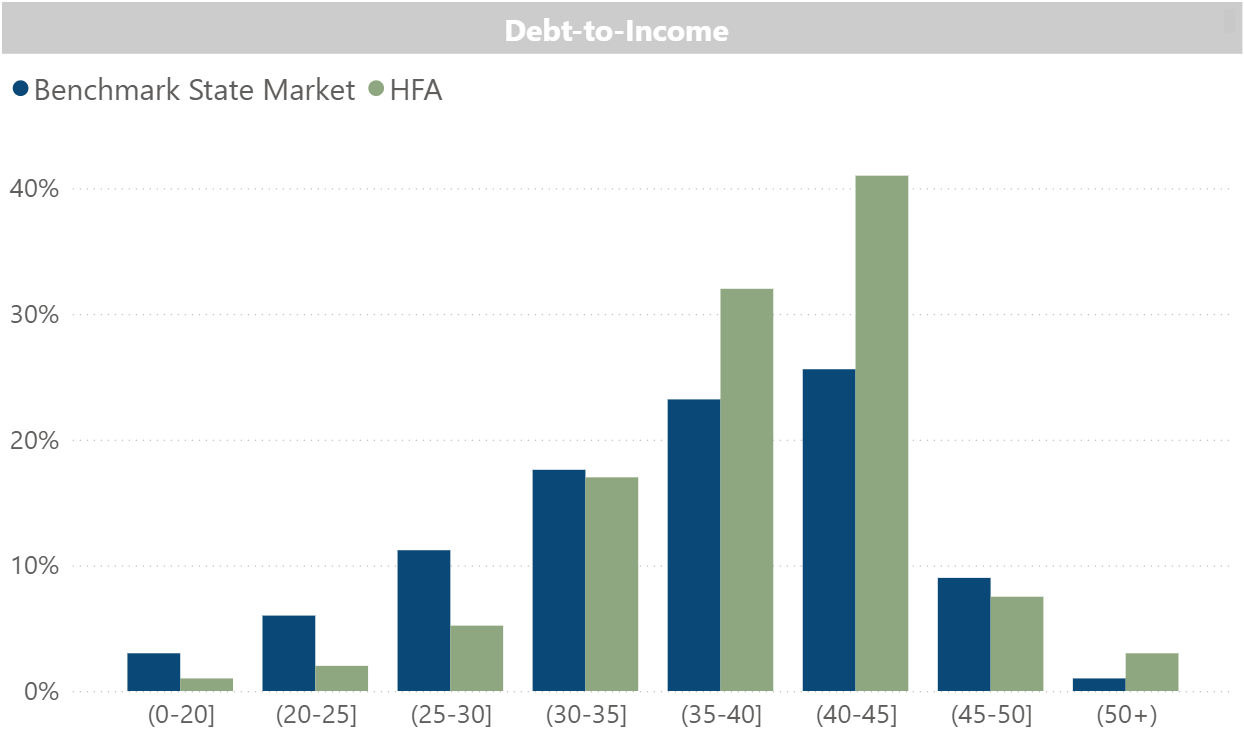
Figure 4: Sample dashboard image of ratio of loans with CLTV equal to or greater than 100% for a hypothetical HFA
Why mortgage industry benchmarks matter for HFA financial management
Internal portfolio monitoring is necessary but may not be sufficient on its own. HFAs operate within a broader housing finance system that includes Fannie Mae, Freddie Mac, private mortgage insurers, the U.S. Department of Veterans Affairs (VA), the U.S. Department of Agriculture (USDA), and the Federal Housing Administration (FHA). These market participants can influence how HFAs design their programs and using them as external benchmarks helps HFAs assess market position and determine whether trends are portfolio-specific or reflect broader market movements.
Benchmarking can draw on several sources,2 and analyzing mortgage-backed securities (MBS) data provides insight into origination trends, borrower characteristics, and loan performance. For HFAs that insure loans, comparing business mix and risk characteristics trends against the subset of loans with mortgage insurance (MI) may be particularly valuable in understanding how other insurers are reacting to market changes. FHA data derived from the Ginnie Mae MBS dataset are also an important benchmark given the overlap with many HFA target borrowers, including first-time homebuyers and low- to moderate-income households. Benchmarking against the proper segment of the mortgage industry can help HFAs identify where their book may carry excess risk, where they are outperforming the market, and where opportunities exist to target new or underserved segments of the market.
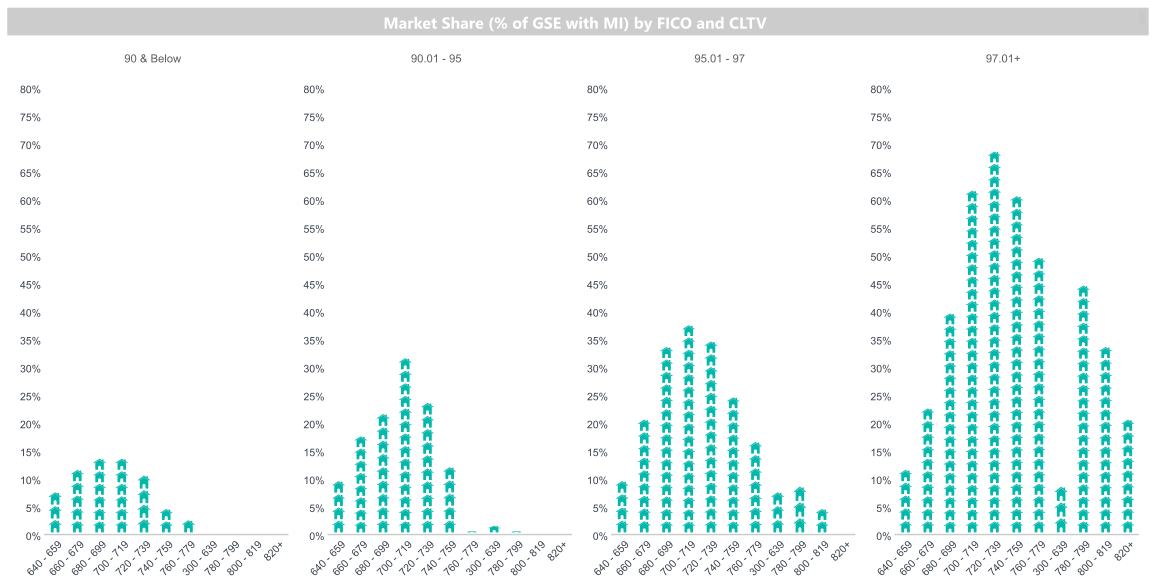
When paired with internal metrics, benchmark reporting—especially via a customizable dashboard—makes these comparisons more actionable by helping HFAs visualize trends, monitor relative performance, and identify emerging risks. For industry benchmarks, dashboards are especially useful for market share analysis. Understanding how much of a state’s first-time homebuyer or affordable lending activity is supported by the HFA can inform strategic planning and program design. As an example, we have designed market share visuals for individual states by FICO Score and CLTV in Figure 5. Benchmark comparisons can also show whether changes in production or delinquency activity reflect internal program shifts or broader market contraction or disturbances.
Figure 5: Market share (% of government-sponsored enterprises’ purchased loans with MI) by FICO and CLTV
How can HFAs better understand their climate risk and portfolio resilience
Climate risk is becoming an increasingly important consideration for housing finance portfolios, including both single-family and multifamily exposures. Physical risks such as floods, wildfires, hurricanes, and severe convective storms can affect many important aspects of business, including collateral values, maintenance costs, rental cash flows, borrower stability, homeowners’ insurance premiums, and availability, repair costs, and default behavior. Since HFAs have geographically concentrated portfolios, these risks are especially important to monitor.
Climate risk in single-family and multifamily portfolios
In a single-family portfolio, climate-related stress may emerge through borrower displacement, rising housing costs, or declining property values. These pressures can be particularly challenging for first-time and lower-income borrowers with limited financial flexibility. For multifamily portfolios, climate events may disrupt operations, reduce occupancy, decrease rental cash flows, and create compliance or habitability concerns.
Dashboard reporting further strengthens an HFA’s understanding of its exposures by visualizing concentrations of climate risk across geographies, property types, and borrower segments. For instance, does an HFA have an outsized exposure to wildfire risk across its single-family portfolio? Sequencing catastrophe models with credit risk models brings quantification of these types of risks into focus. Integrating hazard data with portfolio performance metrics allows HFAs to monitor climate-related risk more proactively and incorporate it into reserve planning and strategic decision making.
Closing thoughts on measuring HFA performance and emerging risks
HFAs operate at the intersection of public mission and financial risk management. Whether they hold loans in portfolio, insure loans, oversee servicing, or finance multifamily housing, they need clear, actionable performance metrics to guide decision making.
Core metrics such as delinquency trends, servicing outcomes, reserve adequacy, and market share provide critical insight into portfolio health. When paired with external benchmarking and climate risk analysis, dashboard reporting gives HFAs a more complete view of performance and emerging risks. Together, these tools support stronger risk management, better strategic planning, and more-effective communication with stakeholders.
How Milliman can help
Milliman’s Mortgage Solutions group serves organizations across the mortgage ecosystem, including government-sponsored entities, private mortgage insurers, and HFAs. Our capabilities include dashboard reporting, loan loss reserve modeling, down payment assistance loan analysis, climate risk quantification, insurance pricing, risk retention and reinsurance analysis, mission-oriented program development and more. Explore Milliman's mortgage consulting services to find out how we can help your agency develop a strategic risk profile dashboard.
1 Cray, A. (2022, November 15–17). A Brief History of U.S. Housing Finance Agencies [Conference presentation]. National Association of Local Housing Finance Agencies 2022 Fall Educational Conference, Washington, D.C., United States. Retrieved August 17, 2026, from https://www.nalhfa.org/assets/2022fallconference/Presentations/1.%20NALHFA%20Conference_HFA%20History%20of%20Housing%20Finance_Adam%20Cray.pdf.
2
MBS data are published so investors in MBS can evaluate loan origination and performance.
Fannie Mae data are available at
https://capitalmarkets.fanniemae.com/mortgage-backed-securities.
Freddie Mac data are available at
https://capitalmarkets.freddiemac.com/mbs/security-data/mbs-disclosure-resources.
Ginnie Mae data are available at
https://www.ginniemae.gov/disclosure/disclosure-resources/disclosure-data-download-layouts-and-sample-files.