Quarterly mortgage market summary
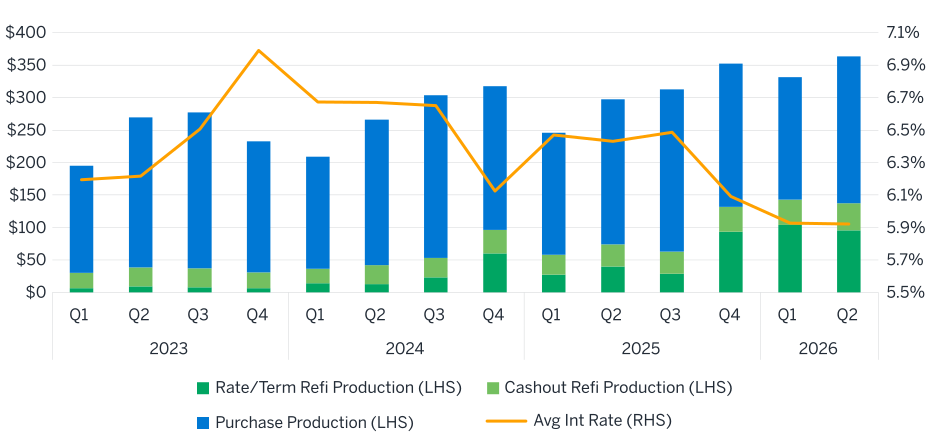
Agency mortgage securitizations increased 24% in the second quarter (Q2) 2026 on a year-over-year basis. Securitization volumes of new agency mortgages (Fannie Mae, Freddie Mac, and Ginnie Mae) were $373 billion for Q2, based on data from the Milliman Mortgage Reporting Platform.
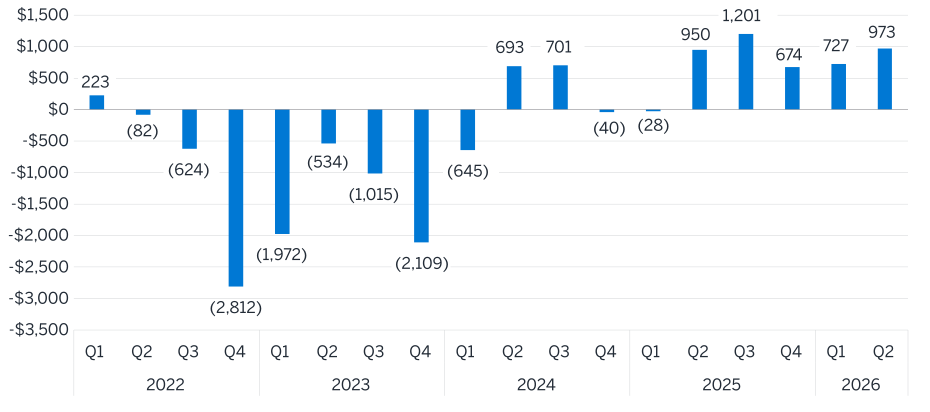
The Mortgage Bankers Association (MBA) reports that mortgage lenders remained profitable during the quarter, with the average lender generating a $973 profit for each loan originated in Q2 2026, an increase from $727 in Q1 2026 and a slight increase from $950 in Q2 2025.
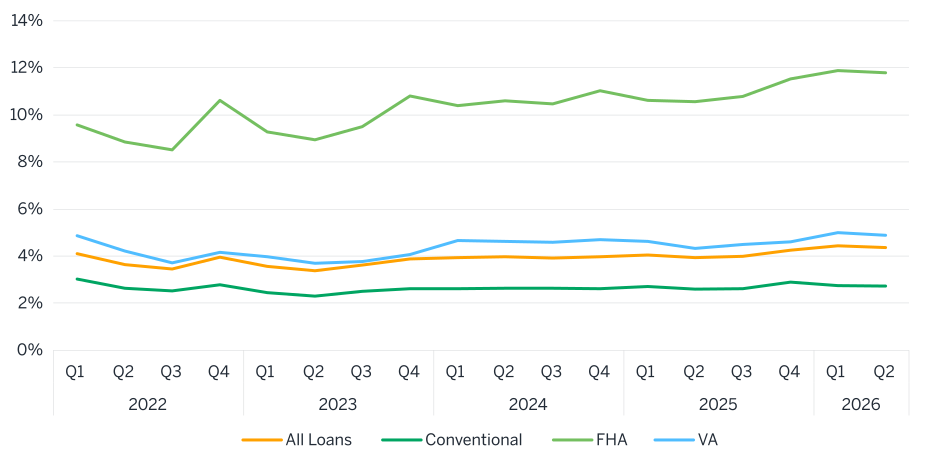
Agency mortgage loan delinquencies remained elevated at 4.4% in Q2 2026, essentially flat with Q1 2026 and up from 3.9% in Q2 2025.
Purchase and refinance origination trends
Single-family agency mortgage securitizations rose 23.6% year-over-year from $301 billion in Q2 2025 to $373 billion in Q2 2026. This increase was driven by refinance activity, which rose 84.7% year over year, while purchase mortgage activity increased 1.7%. The 30-year mortgage rate generally declined in 2025, resulting in increased refinance activity. Note that the chart below shows volume by MBS issuance quarter. There is generally a lag between the mortgage lock date and the issuance date of the mortgage into a security.
Figure 1: Agency mortgage securitizations ($ billions) and the 30-year mortgage rate
Source: MMRP
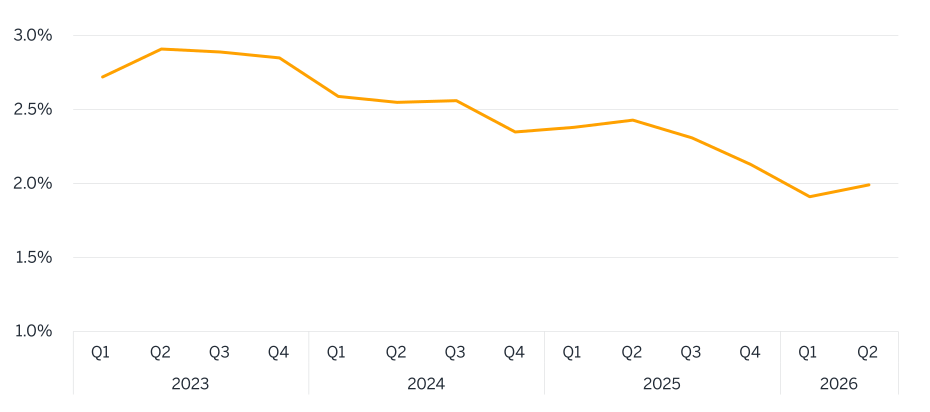
The Primary–Secondary (30-year mortgage to 10-year Treasury) spread narrowed 44 basis points year over year before increasing 8 basis points in Q1 2026, interrupting the general tightening trend that began in Q2 2023. The Primary–Secondary spread has moved in general correlation with Treasury yields. This reversal was driven, in part, by higher interest-rate volatility.
Figure 2: The primary–secondary spread
Source: FRED
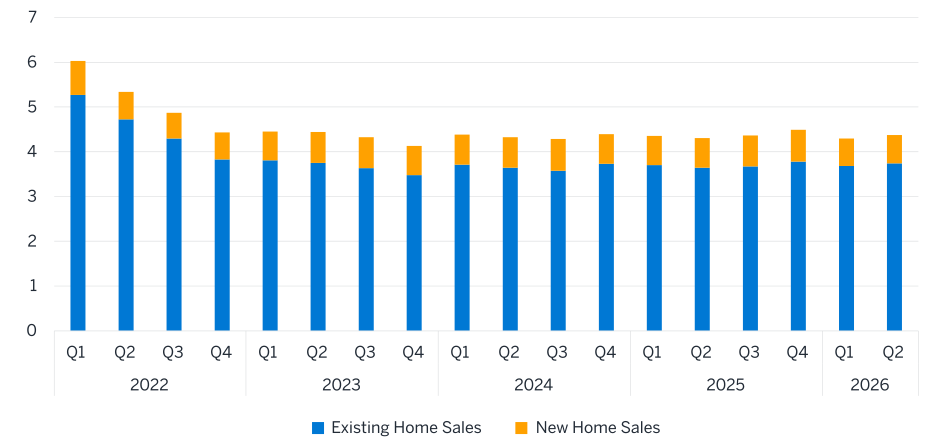
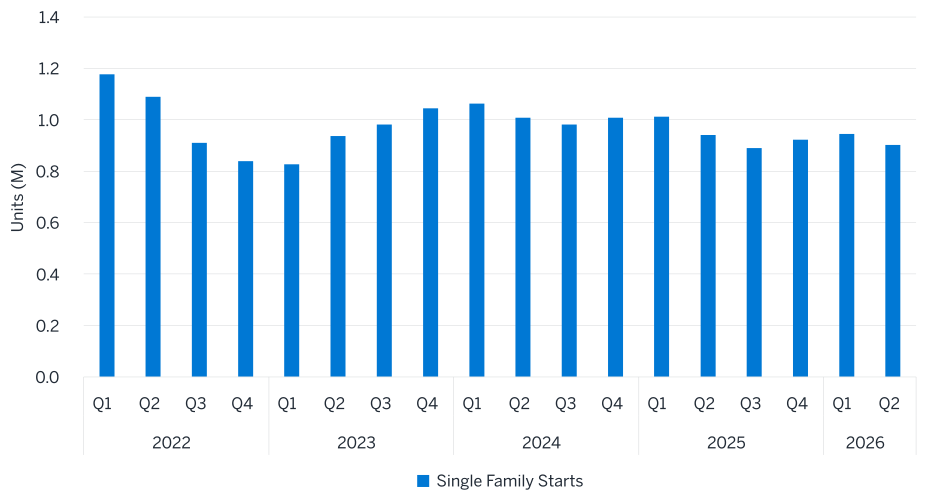
The count of existing home sales increased in Q2 2026, with year-over-year sales up 3% and quarter-over-quarter sales up 2%. New home sales fell 5% year-over-year but increased 1% quarter-over-quarter. Single-family housing permits and starts were down 2% and 4%, respectively, in Q2 2026 on a year-over-year basis.
Figure 3: Existing and new home sale counts annualized (millions)
Source: Moody’s Analytics
Figure 4: Single-family starts annualized (millions)
Source: Moody’s Analytics
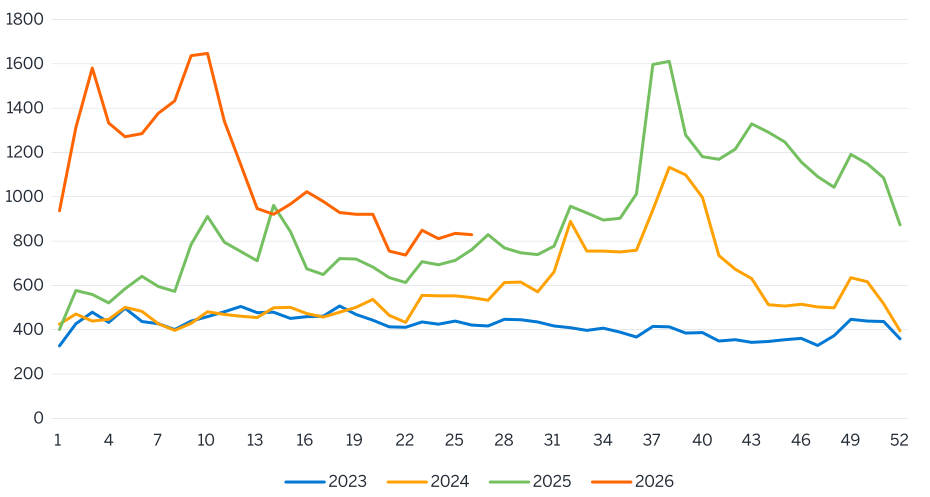
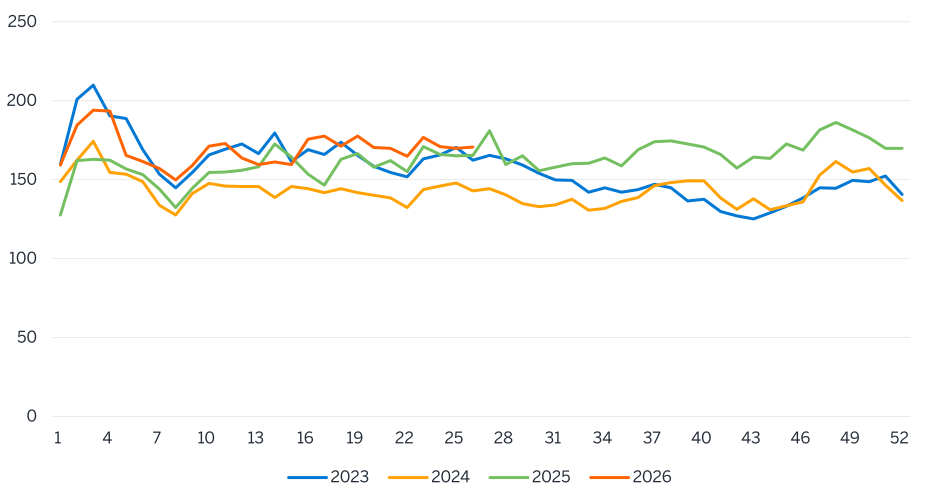
According to the MBA, applications to refinance a home in Q2 2026 were down 33% from Q1 2026 but up 22% from the same period in 2025 (weeks 14 through 26). Applications for purchase were effectively flat compared to Q1 2026 but remained above levels observed in the same period in 2023, 2024, and 2025.
Figure 5: MBA refinance application index (by week)
Source: MBA
Figure 6: MBA purchase application index (by week)
Source: MBA
Mortgage lenders and their financial performance
In Q2 2026, mortgage lenders earned $973 for every loan originated in the quarter, up from $727 in Q1 2026 and slightly higher than $950 in Q2 2025. With the increase in mortgage rates in the quarter, lenders may find it difficult to sustain this positive momentum in the coming quarters.
Figure 7: Net income per originated loan
Source: MBA
Consumer health and the lending environment
The overall economy remains resilient, with the unemployment rate ending Q2 2026 at 4.2%, down from 4.3% in Q1 2026. The decline in labor force participation was a contributing factor to the lower rate in Q2. Total household debt rose 2.1% from Q2 2025 to Q2 2026. Seasonally adjusted agency mortgage loan delinquencies ended Q2 2026 at 4.4%, remaining near the highest rate in over three years. Federal Housing Administration (FHA) loans are primarily responsible for the elevated rates. This can be attributed to a policy change related to trial payment plans for FHA. As noted by the CPL,1 the new loss mitigation policy requires borrowers to complete a trial payment plan before receiving home retention options from FHA. Borrowers in the process of their trial payment plan are reported as delinquent, therefore driving up 90D+ DQ rates for FHA. Outside of FHA loans, most mortgage portfolios observed generally stable delinquency trends.
Figure 8: Conventional and government delinquency rate (30, 60, 90+ days delinquency excl foreclosure), SA
Source: Moody’s Analytics
At the conclusion of Q2 2026, according to the University of Michigan's Surveys of Consumers, consumers' expectations regarding inflation in five years were 3.3%, up slightly from 3.2% in Q1 2026 but down from 4.0% in Q2 2025.
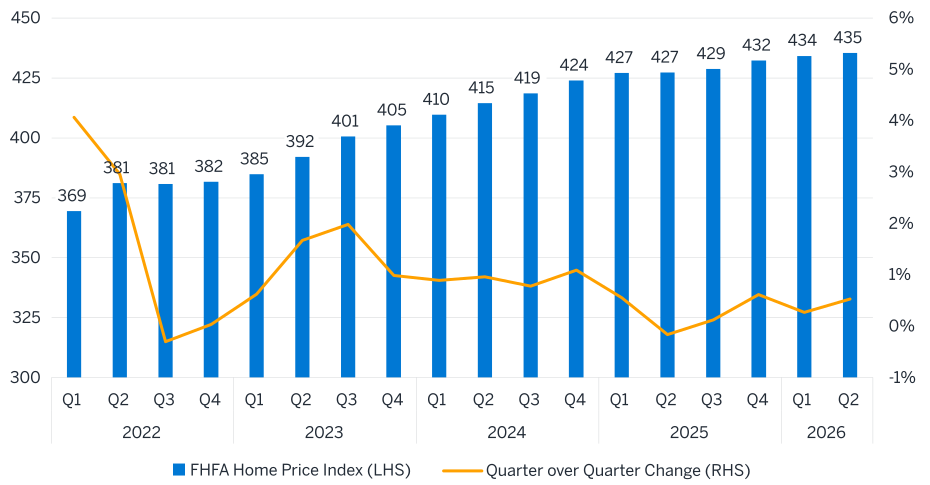
On an annual basis, home prices rose 1.9% in Q2 2026 according to the Federal Housing Finance Agency (FHFA). Home prices increased 0.3% quarter over quarter, the fourth consecutive quarter of growth.
Figure 9: FHFA purchase-only home price index (base of 100 in Q1 1991)
Source: Moody’s Analytics
1 A policy-related reporting change, not increasing financial distress, drove the late 2025/early 2026 increase in the FHA serious delinquency rate. (2026, March 25). Central for Responsible Lending. Retrieved September 11, 2026, from https://www.responsiblelending.org/research-publication/policy-related-reporting-change-not-increasing-financial-distress-drove-late.