Executive summary
Oncology remains one of the largest and most complex therapeutic classes in the pharmacy landscape. We estimate total U.S. oncology drug spending was near $200 billion as of 2025 and project it to exceed $400 billion by 2030, driven by a combination of pipeline launches, expanded indications for existing therapies, and continued growth of existing therapies. This type of volume and growth demands the attention of payers, providers, and policymakers alike. Unlike most other drug classes, oncology straddles the medical and pharmacy benefit, creating unique dynamics across Medicare, commercial, and Medicaid markets. The introduction of maximum fair prices (MFPs) under the Inflation Reduction Act's (IRA’s) Medicare Drug Price Negotiation Program (MDPNP), combined with an unprecedented pipeline of novel therapies, will keep oncology as a class to watch over the coming years.
This paper examines the current state of oncology drug spending by market segment, the evolving drug mix between generics, biosimilars, and specialty products, and the regulatory and pipeline developments that will define the next era of oncology. Note, oncology treatments beyond prescription drugs are outside the scope of this paper.
Background: Why oncology drug spending has outpaced spending in other classes
Oncology has consistently ranked among the largest therapeutic areas in pharmacy spending over the past decade. An aging population, improved cancer screening, and longer cancer survival times have expanded the population treated by oncology drugs. Further, recent therapeutic innovation has included newly available precision medicines, antibody-drug conjugates (ADCs), and cell and gene therapies.
Based on our analysis of historical Medicare, Medicaid, and commercial claims, total annual U.S. oncology drug spending growth has averaged 20% from 2021 to 2025, outpacing overall pharmaceutical gross spending growth of 16%. This growth trajectory is expected to continue through 2030, driven by pipeline launches, expanded indications for existing therapies, and continued growth of existing therapies.
Oncology presents a set of characteristics that distinguish it from other therapeutic classes, resulting in unique implications for future regulatory and landscape changes:
- Spanning medical and pharmacy benefits: Oncology is one of only a few drug classes that extensively spans both medical and pharmacy benefits. Physician-administered drugs are typically offered through the medical benefit and include injectable and infused products, such as ADCs and traditional intravenous chemotherapies. Self-administered drugs are offered through the pharmacy benefit and include drugs dispensed through specialty or retail pharmacies, such as oral oncolytics.
- Clinical and cultural sensitivity: Cancer treatment decisions are highly individualized, and treatment is often life-or-death. Although its use has increased in recent years, payer intervention through utilization management tends to be more limited than other classes, as it must balance cost control with the urgent nature of treatment decisions and clinical and cultural sensitivity around cancer outcomes. For example, oncology drugs (antineoplastics) benefit from special protections in Medicare Part D as one of six protected classes.1 This designation requires plans to cover “all or substantially all” drugs within the class but does not exempt drugs from utilization management.
- Specialty product dominance: The majority of oncology products are considered specialty drugs, which are typically higher cost, and few have generics or biosimilars available. Further, oncology drugs tend to be less clinically interchangeable than those in other classes, so making formulary changes to curb increases in spending can be difficult for payers.
The oncology drug spend landscape: How do the Medicare, Commercial, and Medicaid markets contribute to total oncology spend?
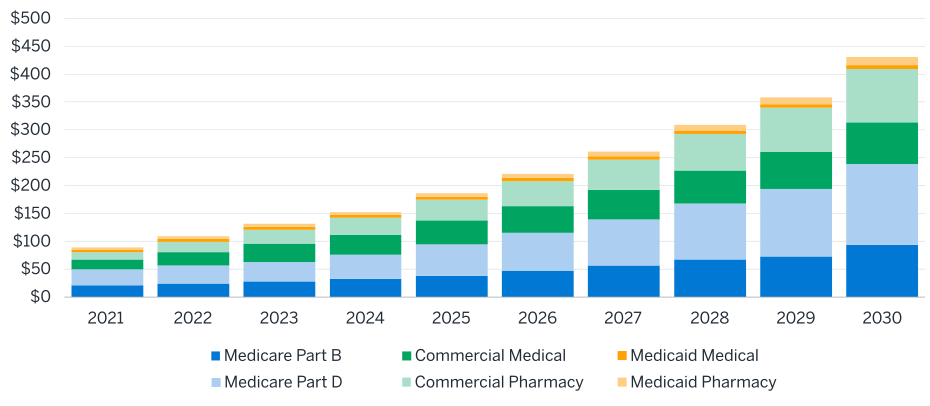
We estimate oncology drug spend to grow from $200 billion in 2025 to over $400 billion by 2030. Figure 1 shows this growth by market.
Figure 1: Estimated oncology spend by market and benefit through 2030 (billions)
Medicare
Medicare represents 51% of oncology drug spend in 2025, reflecting the higher cancer incidence in the 65 and over population. Oncology spending in Medicare is divided between Part B (physician-administered) and Part D (self-administered) benefits, each with distinct dynamics.
- Protected class implications: Since oncology drugs are a protected class under Part D, plans must cover all or substantially all oncology drugs on formulary. Manufacturers face reduced pressure to offer significant rebates or discounts relative to other Part D classes, as plans cannot meaningfully threaten exclusion. There is no equivalent protected class designation for Part B, though plans typically cover virtually all Part B drugs. Historically, plans have primarily managed oncology through limited utilization management criteria rather than coverage restrictions. However, in recent years, step therapies and prior authorizations have become more prevalent to manage oncology costs.2
- MDPNP: Several oncology drugs have been selected across the first three Part D selected drug cohorts, including Imbruvica, Calquence, Ibrance, Pomalyst, Xtandi, Erleada, Kisqali, Lenvima, and Verzenio.3 These selections target higher-expenditure Part D oncology agents with substantial Medicare utilization. Future negotiation cycles will include oncology drugs covered under Part B, likely including some of the highest-volume oncology drugs. By 2030, we project MFPs will reduce total Medicare oncology drug spending by $4.7 billion annually, with the majority of savings concentrated in Part B drugs as the program expands beyond Part D.4 However, several drugs selected for negotiation are expected to remain selected for only a short period of time due to upcoming generic availability.
- IRA benefit redesign: The annual out-of-pocket maximum in Part D limits the direct beneficiary-level savings from MFPs or biosimilars for high-cost drug users. The vast majority of Part D oncology drug utilizers reach the catastrophic phase. A similar dynamic exists for Part B drugs for Medicare Advantage enrollees, though to a lesser extent since average out-of-pocket limits are higher in Part B than Part D ($9,250 for Medicare Advantage and $2,100 for Part D in 2026).5
- Part B versus Part D dynamics: The split between Part B (medical) and Part D (pharmacy) benefits creates a dynamic unique to the Medicare market. We estimate Part B oncology spending will grow at approximately 19% annually from 2023 to 2026, driven by the expansion of infusion-based regimens and high-cost biologics. Part D oncology spending is expected to grow even faster, at 25% annually, partly driven by increased uptake following improved affordability associated with the IRA benefit redesign.
Commercial
Commercial, inclusive of Affordable Care Act (ACA) and employer coverage, represents 43% of oncology spend in 2025. Unlike Medicare, medical and pharmacy benefits are typically integrated in the commercial market.
- Formulary management: Unlike Medicare Part D, commercial plans are generally not bound by protected class requirements for oncology drugs. This enables plans to exclude specific oncology agents from formulary when clinically appropriate alternatives exist and can drive market share toward lower net cost options. Plans also have more flexibility over utilization management controls, including step therapy or site-of-care management. However, the clinical sensitivity of oncology limits the aggressiveness with which plans deploy these tools.
- Employer cost management: A growing number of commercial payers, particularly large self-insured employers, are implementing strategies to help bend the growing cost curve of oncology drugs. Some plans carve oncology drugs out of traditional pharmacy benefit manager (PBM) arrangements and manage them through specialized oncology benefit managers or value-based contracting arrangements. Another strategy used is employing specialty cost management vendors who provide real-time clinical review of oncology prescriptions and site-of-care optimization. Employers may also use stop-loss policies to avoid unexpected impacts from catastrophic oncology claims.
- Network steerage: In some cases, commercial plans use narrow provider networks as a means to manage medical spend. For provider-administered oncology drugs, using network design as a cost management approach may be an option, as plans can steer oncology patients toward preferred providers. Similarly, plans may steer patients toward preferred pharmacies for oncology drugs administered through the pharmacy benefit.
Medicaid
Medicaid represents a relatively small but still impactful 6% of oncology drug spending in 2026. Oncology management in Medicaid operates under a distinct regulatory and economic framework, with regulations frequently varying by state.
- Preferred drug lists (PDLs): State Medicaid agencies and managed care organizations (MCOs) use PDLs to manage oncology and other drug spending. Unlike other markets, oncology rebates are more significant in Medicaid due to statutory rebates under the Medicaid Drug Rebate Program (MDRP). Manufacturers may also offer supplemental rebates.
- Medicaid eligibility: After a period of growth following Medicaid expansion under the public health emergency, enrollment is expected to decline under H.R.1, with the expectation of reducing Medicaid costs6 and shifting patients to the commercial market or the uninsured population.
Drug type landscape
Overview of the oncology drug mix
Oncology drug spend comes overwhelmingly from specialty brands and biologics, with limited generic penetration and low but growing biosimilar adoption. Figure 2 shows projected oncology drug spend by drug type.
Figure 2: Estimated oncology spend by drug type and benefit through 2030 (billions)
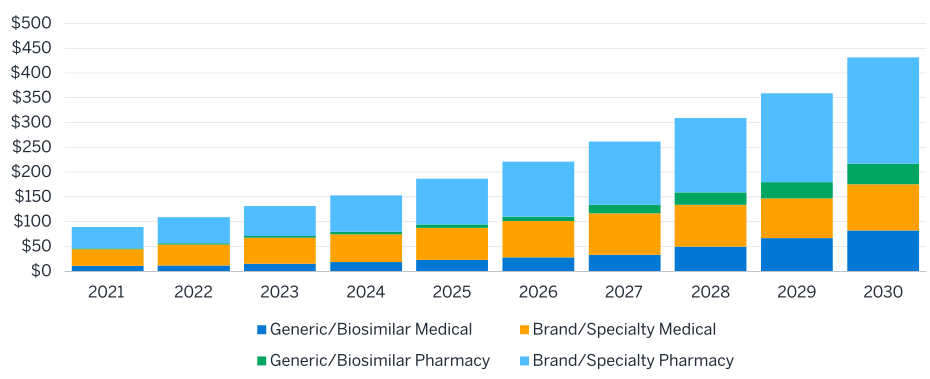
Generic and biosimilar utilization remains low but has grown in recent years and is likely to modestly grow over time. The oncology biosimilar market has expanded substantially with the entry of biosimilars for Avastin (bevacizumab), Herceptin (trastuzumab), Rituxan (rituximab), and Neulasta (pegfilgrastim). Biosimilar uptake is likely to grow as new biosimilars launch for several market leaders in the next few years, as described below. There are still few true generics in the oncology class. We estimate generics and biosimilars will grow from $29 billion in 2025 to $124 billion in 2030.
The vast majority of oncology drug expenditure is concentrated in brand and specialty products. Based on our analysis, brand and specialty oncology drugs account for 84% of total oncology drug spend in 2025.
Big changes are coming for oncology market leaders
Several major oncology drugs face selection for the MDPNP and loss of exclusivity (LOE) over the next five years, both of which have significant implications for the spend trajectory. Below are some examples.
- Keytruda (pembrolizumab): As the highest-revenue drug (oncology or otherwise), Keytruda's eventual LOE represents one of the single most significant LOE events in pharmaceutical history. Keytruda’s LOE is expected to be as early as 2028 but could be delayed.7
Keytruda is expected to be selected for the MDPNP for 2029.8 Its selection would reduce Medicare expenditures temporarily, but it will be deselected from the program following biosimilar entry, which could be as early as 2030, meaning it would be selected for just one year, barring any biosimilar delays.
The FDA recently approved9 Keytruda Qlex, a subcutaneous version of Keytruda, which may mitigate impacts of patent expiration. - Opdivo (nivolumab): Opdivo has the second-highest revenue among oncology drugs. Opdivo's LOE is expected to occur in 2028.10 Similar to Keytruda, Opdivo is likely to be selected for the MDPNP in 2029 and may only be selected for one year. The recently approved11 Opdivo Qvantig, a subcutaneous injection, may offset volume loss from the LOE.
- Xtandi (enzalutamide): Xtandi has the highest revenue among Part D oncology drugs. Xtandi’s LOE is expected in 2027.12 Xtandi has already been selected for the MDPNP, and its MFP will take effect as of January 1, 2027.13 Its MFP is likely to be in place for only a year or two depending on generic availability following its LOE.
Other oncology market leaders, including Darzalex, Ibrance, Erleada, and Lynparza, are expected to have LOEs between 2027 and 2029. Several oncology drugs have already been selected for the MDPNP in 2026 through 2028, as noted earlier. We project the biosimilar share of oncology spending to grow from 16% in 2025 to 29% by 2030, driven primarily by the LOEs of these market leaders.
However, a strong pipeline is coming to replace leading brand and specialty products. The oncology pipeline remains the largest of any therapeutic area, with dozens of drugs in active clinical development as of 2026. Much of the oncology pipeline is focused on non-small cell lung cancer, breast cancer, and multiple myeloma. Many major manufacturers report pipeline products for at least one of these indications.14,15,16,17,18 Most major manufacturers have multiple oncology products in their pipeline.
What's next for oncology drugs?
Oncology is poised to remain a high-growth, high-spend therapeutic class through 2030 and beyond. The combination of rising incidence, a strong pipeline, and longer treatment durations is likely to contribute to high trends, though growth may be partially mitigated by savings from the MDPNP and biosimilar availability.
Unlike other products starting to see significant volume through direct-to-patient programs, oncology drugs are likely to remain in the insurance benefit. However, the MDPNP, as well as other policies, including most-favored nations, may influence how manufacturers price and launch oncology products in the future.
Methodology
Data sources
We used the following sources to summarize historical oncology spending:
- Medicare: The Centers for Medicare and Medicaid Services’ (CMS’s) publicly available 2021 through 2025 Part B and Part D drug spending dashboards
- Medicaid: CMS’s publicly available 2021 through 2024 Medicaid drug spending dashboard
- Commercial: Milliman’s 2021 through 2024 Consolidated Health Cost Guidelines™ Sources Database (CHSD), which contains medical and pharmacy benefit claims for over 30 million commercial lives
Modeling
Medical and pharmacy costs within each payer market were projected using applicable enrollment data and projected through 2030 using oncology utilization and cost trends developed through internal Milliman research. Separate trends were applied to medical and pharmacy costs within each market (commercial, Medicare, Medicaid). Future trends are difficult to predict but were based on a combination of recent historical patterns and pipeline forecasts.
The following additional adjustments were applied:
- Medicare: Adjustments for the MDPNP were incorporated beginning in 2026 to reflect applicable known and estimated selections for MFPs based on Milliman research. An additional adjustment was applied to account for Medicare Advantage spending not captured in the CMS Part B dashboard.
- Medicaid: An adjustment was applied to account for 340B spending not captured in the CMS Medicaid dashboard.
LOE
Oncology drugs were identified for LOE modeling if they represented more than 1% of total oncology spending and had an LOE date prior to 2030. Based on these criteria, the following drugs were included in the LOE analysis: Keytruda, Opdivo, Xtandi, Darzalex, Ibrance, Erleada, and Lynparza.
To estimate the potential impact of LOE, analogs from currently marketed oncology biosimilars were analyzed to develop assumptions for both the biosimilar cost relative to the reference product and biosimilar utilization uptake over a four-year period following LOE. For each drug subject to the LOE analysis, projected spending was shifted from the brand/specialty category to the generic/biosimilar category based on the assumed cost relative and utilization uptake. No assumptions were made regarding which specific biosimilar products would launch in place of the individual reference products included in the analysis. The LOE methodology instead relies on observed market analogs to establish generalized assumptions for cost reduction and biosimilar utilization uptake.
1 Centers for Medicare and Medicaid Services. (May 16, 2019). Medicare Advantage and Part D drug pricing final rule (CMS-4180-F). Retrieved October 19, 2026, from https://www.cms.gov/newsroom/fact-sheets/medicare-advantage-and-part-d-drug-pricing-final-rule-cms-4180-f.
2 Hamad, L., Page, C., & Berman, M. (April 10, 2026). Understanding oncology step therapy in Medicare Part D: Considerations for life science companies. Milliman. Retrieved October 19, 2026, from https://www.milliman.com/en/insight/understanding-oncology-step-therapy-in-medicare-part-d.
3 Centers for Medicare and Medicaid Services. (September 22, 2026). Selected drugs and negotiated prices. Retrieved October 19, 2026, from https://www.cms.gov/initiatives/medicare-prescription-drug-affordability/overview/medicare-drug-price-negotiation-program/selected-drugs-negotiated-prices.
4 Based on Milliman projections of selected drugs and MFPs in each year.
5 Centers for Medicare and Medicaid Services. (April 7, 2025). Announcement of calendar year (CY) 2026 Medicare Advantage (MA) capitation rates and Part C and Part D payment policies. Retrieved October 19, 2026, from https://www.cms.gov/files/document/2026-announcement.pdf.
6 Swagel, P. L. (June 12, 2025). Re: Distributional effects of H.R. 1, the One Big Beautiful Bill Act. Congressional Budget Office. Retrieved October 19, 2026, from https://www.cbo.gov/system/files/2025-06/61387-Distributional-Effects.pdf.
7 Bratulic, A. (February 3, 2026). Merck & Co. signals confidence in defending Keytruda beyond 2028 cliff. FirstWord Pharma. Retrieved October 19, 2026, from https://firstwordpharma.com/story/7090843.
8 Gardner, J. (June 15, 2026). Medicare drug price rule may target under-the-skin Keytruda and Opdivo. BioPharma Dive. Retrieved October 19, 2026, from https://www.biopharmadive.com/news/medicare-drug-price-negotiation-IV-subcutaneous-opdivo-keytruda/822899/.
9 U.S. Food and Drug Administration. (September 19, 2025). FDA approves pembrolizumab and berahyaluronidase alfa-pmph for subcutaneous injection. Retrieved October 19, 2026, from https://www.fda.gov/drugs/resources-information-approved-drugs/fda-approves-pembrolizumab-and-berahyaluronidase-alfa-pmph-subcutaneous-injection.
10 Pharma Patent Cliff. (October 8, 2026). Opdivo patent expiration. Retrieved October 19, 2026, from https://pharmapatentcliff.com/opdivo.
11 U.S. Food and Drug Administration. (December 27, 2024). FDA approves nivolumab and hyaluronidase-nvhy for subcutaneous injection. Retrieved October 19, 2026, from https://www.fda.gov/drugs/resources-information-approved-drugs/fda-approves-nivolumab-and-hyaluronidase-nvhy-subcutaneous-injection.
12 Medivation, Inc. (2015). Form 10-K 2014. U.S. Securities and Exchange Commission. Retrieved October 19, 2026, from https://www.sec.gov/Archives/edgar/data/1011835/000119312515062576/d850483d10k.htm.
13 Centers for Medicare and Medicaid Services. (January 2025). Medicare Drug Price Negotiation Program: Selected drugs for initial price applicability year 2027. Retrieved October 19, 2026, from https://www.cms.gov/files/document/factsheet-medicare-negotiation-selected-drug-list-ipay-2027.pdf.
14 Pfizer. (August 4, 2026). Oncology drug pipeline & cancer clinical trials. Retrieved October 19, 2026, from https://www.pfizer.com/science/oncology-cancer/pipeline.
15 Lilly. (n.d.). Pipeline. Retrieved October 19, 2026, from https://www.lillyoncologypipeline.com/pipeline/.
16 GSK. (n.d.). Oncology pipeline. Retrieved October 19, 2026, from https://gskusmedicalaffairs.com/pipeline-and-products/oncology-pipeline/.
17 Takeda. (n.d.). Our oncology pipeline. Retrieved October 19, 2026, from https://www.takedaoncology.com/science/pipeline/.
18 Merck. (August 5, 2026). Our pipeline at a glance. Retrieved October 19, 2026, from https://www.merck.com/research/product-pipeline/.